NFL | Thursday, October 22

Patriots vs Bears on Thursday Night Football: Drake Maye Against Caleb Williams, Two 4 and 2 Teams, And A Line That Has Moved From 1.5 To 3

New England Patriots at Chicago Bears, NFL Week 7, Thursday Night Football, Featured Game of the Day

Both teams are 4 and 2, and both quarterbacks came out of the 2024 draft two picks apart. Drake Maye has thrown 10 touchdowns and one interception during New England's three game winning streak. Caleb Williams just came back from a hamstring injury that cost him three games and went 30 for 36 for 305 yards in a win at Atlanta. Chicago runs the ball for an NFL high 160.7 yards a game. DraftKings opened the Bears as 1.5 point favorites, and the number is now 3, the most important number in football.
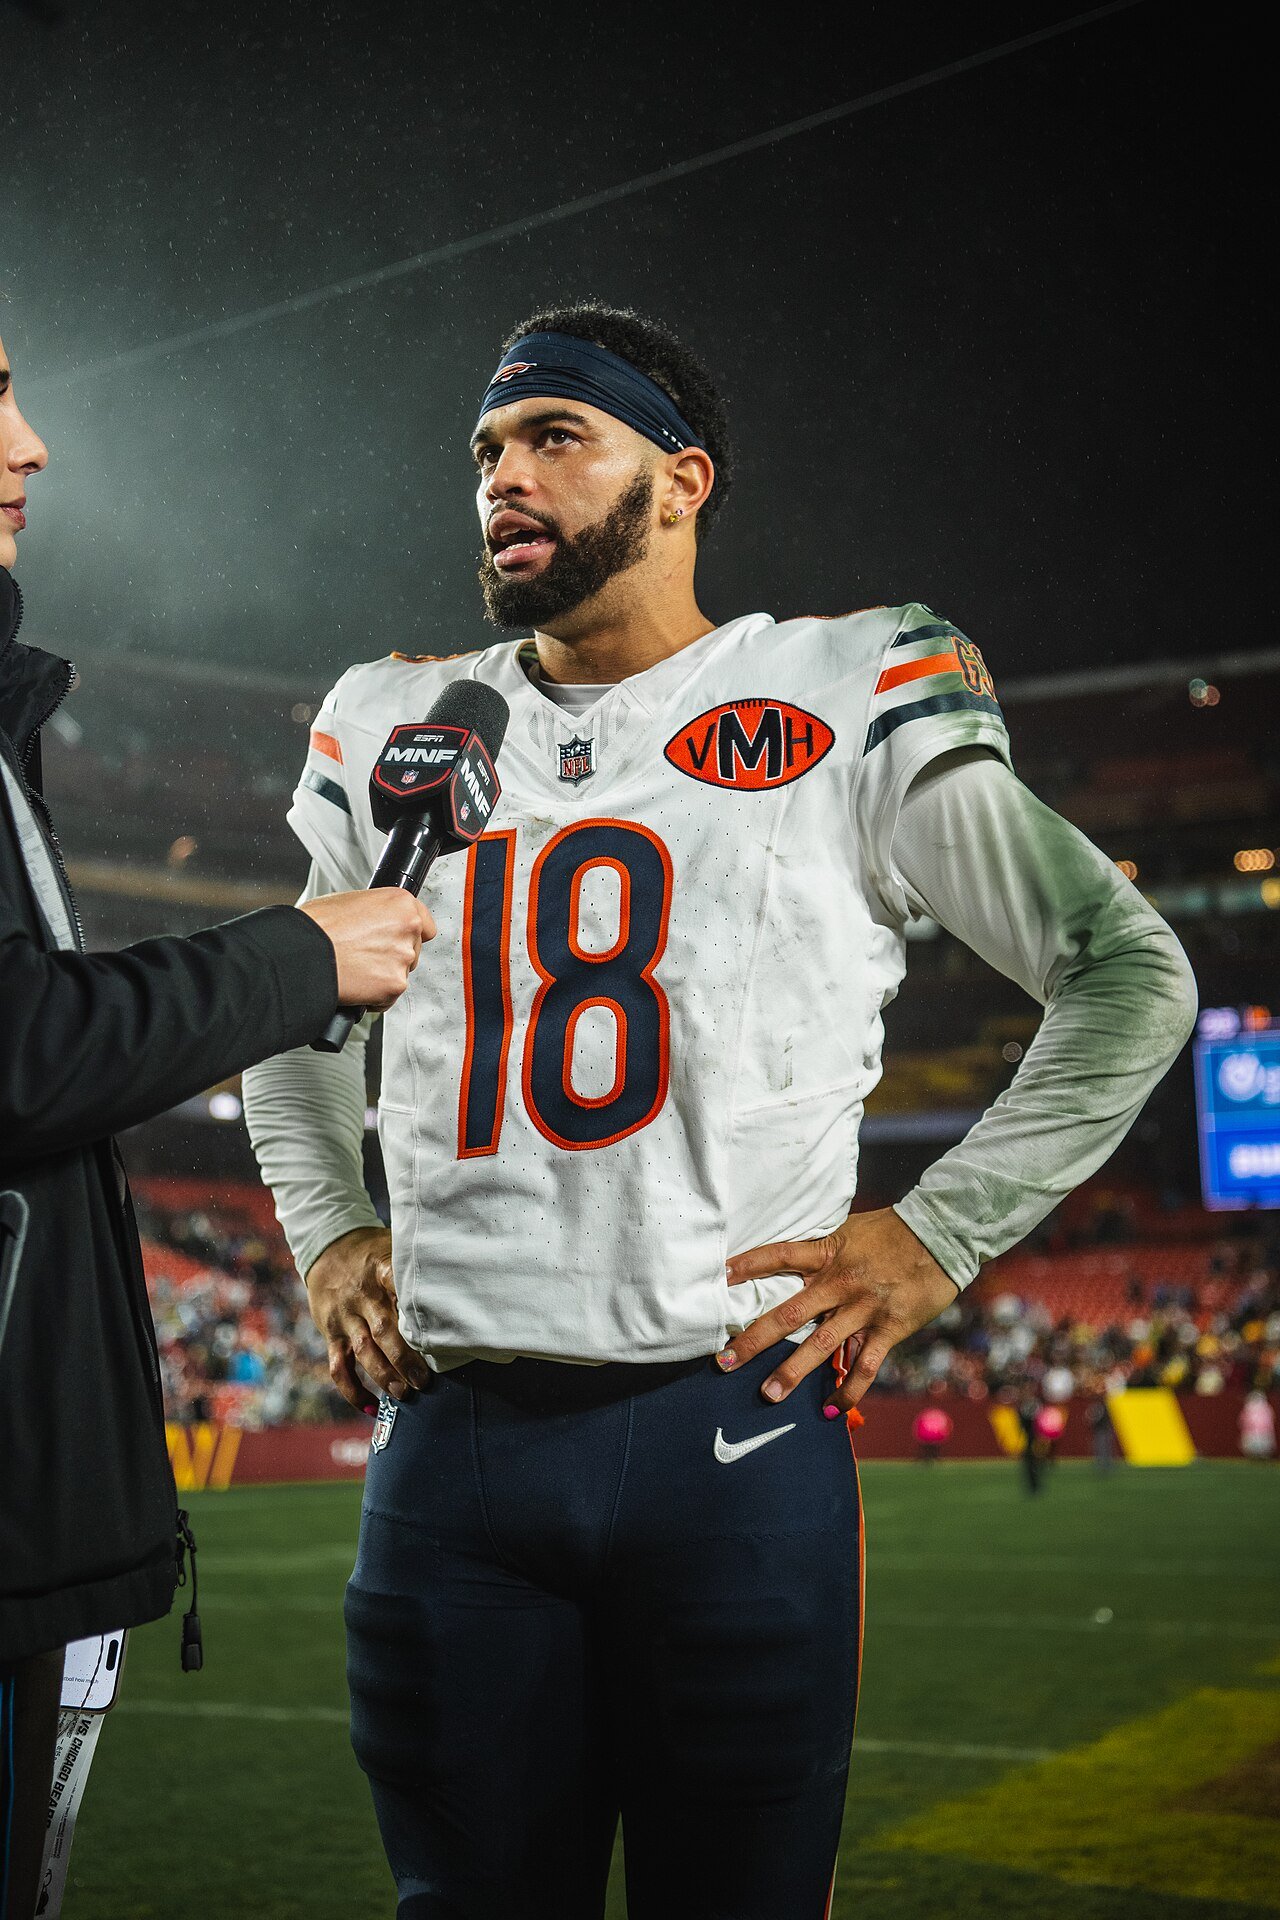

Bears quarterback Caleb Williams in his white number 18 jersey speaking into a microphone on the field after a night game
Caleb Williams (18) talks to a reporter on the field after Chicago's Monday night game at Washington in Week 6 of the 2025 season | Photo: Joe Glorioso, All-Pro Reels, CC BY-SA 4.0, via Wikimedia Commons

New England Patriots Patriots vs Bears Chicago Bears

Thursday, October 22, 2026 | 5:15 PM PT / 8:15 PM ET | Soldier Field, Chicago, IL | Prime Video
NFL Week 7 | Patriots 4, 2 | Bears 4, 2 | Patriots lead the all time series 11, 5 including the playoffs
Spread
NE +3 (-118) / CHI -3 (-102)
Moneyline
NE +130 / CHI -155
Total
O/U 50.5 (o -118 / u -102)
Implied Probability
NE 43.5% / CHI 60.8%
Lines: DraftKings via ESPN, read 2:28 PM PT October 22. Opened CHI -1.5 (-105), CHI -120 / NE +100, total 47.5 (-110 both ways).

Matchup Context

Two 4 and 2 teams, two young quarterbacks from the same draft class, and a short week. Williams went first overall to Chicago in 2024; Maye went third to New England. Per the Associated Press preview on ESPN, they grew up going to the same football camps, and both coaching staffs spent the week talking about the same thing: quarterbacks who hurt you when the pocket breaks down.

Chicago has been the more volatile team. The Bears opened with a 59 to 37 win at Carolina, scored 3 points in a 9 to 3 home loss to Minnesota, beat Philadelphia 27 to 7 and the Jets 23 to 12 at home, got blown out 31 to 7 at Green Bay, then won 31 to 23 at Atlanta on Sunday. That adds up to 150 points scored and 119 allowed. New England started 1 and 2 with a 13 to 10 loss at Seattle and a 35 to 6 loss at Jacksonville around a win over Pittsburgh, and has won three straight since: 29 to 26 at Buffalo, 45 to 17 over Las Vegas and 26 to 19 over the Jets. The Patriots have scored 136 and allowed 113.

The last meeting went New England's way, 19 to 3 at Soldier Field on November 10, 2024, and the Patriots lead the series 11 to 5 counting the playoffs, per the AP. Against the spread, the AP lists New England at 3 and 1 with two pushes and Chicago at 4 and 2.

Injury Report & Lineup Notes

New England Patriots
Brown (C) OUT
Center Ben Brown, knee, listed out.
Canada (CB), Prunty (CB) OUT
Channing Canada and Karon Prunty, both hamstring, both out.
Moses (OT) QUESTIONABLE
Tackle Morgan Moses, foot, questionable.
Vera-Tucker (G) IR
Guard Alijah Vera-Tucker, hamstring, on injured reserve.
Chicago Bears
Edwards (LB) DOUBTFUL
T.J. Edwards, hamstring, doubtful.
Sanborn (LB), Monangai (RB) OUT
Jack Sanborn (concussion) and Kyle Monangai (toe), both out.
Stevenson Sr. (CB) QUESTIONABLE
Tyrique Stevenson Sr., hip, questionable.
Johnson Jr. (S) IR
Anthony Johnson Jr. is on injured reserve.

The two lists hit different parts of the field. New England is thin on the offensive line, with its center out, a guard on injured reserve and a starting tackle questionable, the week after the Patriots went a full game without allowing a sack for the first time this season, per the AP. Chicago's problems are at linebacker: Sanborn is out and Edwards is doubtful, which matters against a quarterback the Bears' own defensive coordinator, Dennis Allen, described as someone who "makes people miss." With Monangai out, D'Andre Swift should carry an even bigger share of the Bears' run game. Final inactives come out about 90 minutes before kickoff, 3:45 PM Pacific.

Maye vs The Bears, Williams And The Run Game vs New England

New England offense against the Chicago defense

Maye has been a different player during the winning streak. Per the AP, he has completed 64.1% of his passes for 878 yards and 10 touchdowns with one interception over the last three games, and he can become the first Patriots quarterback since Tom Brady in 2014 to throw at least three touchdowns in four straight games. On the season he has 1,463 yards, 11 touchdowns and 7 interceptions, so nearly all of the turnovers came in the first three weeks. New England averages 8.0 yards per pass attempt and 7.3 net, and Romeo Doubs leads the receivers with 261 yards and 3 touchdowns on 14 catches. The AP's matchup to watch is A.J. Brown against Bears corner Jaylon Johnson: Brown, acquired from Philadelphia in a June trade, was targeted 10 times against the Jets but dropped three and finished with 3 catches for 27 yards.

Chicago's defense allows 19.8 points and 318.5 yards a game, 228.0 of them through the air, and held Atlanta to 257 total yards on Sunday. Austin Booker leads the Bears with 4 of their 17 sacks, and rookie safety Dillon Thieneman leads the team with 39 tackles; the AP notes he is the only rookie defensive back in the league with at least 35 tackles, an interception and a sack. The question is the middle of the field, where Chicago will be without Sanborn and likely Edwards against a quarterback who extends plays.

Chicago offense against the New England defense

This is a running team first. The Bears average an NFL high 160.7 rushing yards per game at 4.5 yards per carry, per ESPN and the AP. Swift has 398 yards and 6 touchdowns on 94 carries, three of those scores in the last two games, and the AP notes he can become the first Bears back since Neal Anderson in 1990 with seven rushing touchdowns in the first seven games. Williams' season line, 66 of 91 for 712 yards, 3 touchdowns and 1 interception, reflects only three games because of the hamstring, and his return at Atlanta was his best: 30 of 36 for 305 yards. Luther Burden III leads the team with 31 catches for 361 yards. Chicago converts 45.46% of its third downs.

New England's run defense is the matchup to circle. The Patriots allow 91.8 rushing yards a game and 18.8 points, both good numbers, and Elijah Ponder has 5.5 sacks. But the Bears' offense is built to stay on the field, and the place it has struggled is the red zone, where Chicago scores touchdowns on only 50.00% of its trips. If New England's defense bends and makes the Bears kick, its offense, which scores touchdowns on 55.56% of red zone trips and points on 88.89%, can trade field goals for touchdowns.

Advanced Stats & Style Profile

New England Patriots (2026)

Record / points for and against4, 2 / 136 and 113
Yards per play (ESPN total yards / offensive plays)5.9 (2,293 / 387)
Yards per pass attempt / net8.0 / 7.3
Yards per rush4.2
Third down conversion40.51%
Red zone TD % / scoring %55.56% / 88.89%
Giveaways / takeaways / margin13 / 7 / minus 6
Sacks allowed / sacks made11 / 14
Yards allowed per game319.3

Chicago Bears (2026)

Record / points for and against4, 2 / 150 and 119
Yards per play (ESPN total yards / offensive plays)5.6 (2,440 / 439)
Yards per pass attempt / net7.1 / 6.1
Yards per rush4.5
Third down conversion45.46%
Red zone TD % / scoring %50.00% / 65.38%
Giveaways / takeaways / margin11 / 9 / minus 2
Sacks allowed / sacks made15 / 17
Yards allowed per game318.5

EPA per play and success rate were not available from the sources read for this article, so the efficiency picture uses ESPN's season team statistics, labelled as ESPN reports them, with yards per play calculated from ESPN's total yards and offensive plays. The profiles are close to mirror images. New England is the more efficient team per snap, 5.9 yards per play to 5.6, and far more efficient throwing the ball, 7.3 net yards per attempt to 6.1. Chicago runs far more plays, 439 to 387 over the same six games, converts more third downs and holds the ball longer, about 36 minutes a game by ESPN's possession totals against about 31 for New England.

The two numbers that could swing this game are turnovers and red zone finishing. New England has 13 giveaways and a minus 6 margin, though Maye's one interception in three games says that has calmed down. Chicago is minus 2. In the red zone, the Patriots come away with points almost nine times in ten, while the Bears have come away empty on about a third of their trips. A Chicago team that moves the ball but settles for field goals is how a 3 point favorite fails to cover.

Keys To The Game

Patriots Keys
Hold up the patched line. With Brown out and Moses questionable, keeping Maye clean against Booker and a 17 sack defense decides whether the passing game that averages 8.0 yards per attempt shows up.
Get Brown going. Three drops on 10 targets last week. A productive Brown against Jaylon Johnson takes pressure off Doubs.
Make Chicago kick. The Bears score touchdowns on only half of their red zone trips. Every stop inside the 20 is worth four points.
Bears Keys
Lean on the run. 160.7 rushing yards a game is the league's best, and long drives keep Maye on the sideline.
Contain Maye outside the pocket. With Sanborn out and Edwards doubtful, rush lane discipline matters as much as sacks.
Finish drives. A 50.00% red zone touchdown rate has to improve against a defense allowing 18.8 points a game.

Market Context

DraftKings opened Chicago at 1.5 with the moneyline at Bears -120 and Patriots +100, essentially a coin flip with the home team slightly favored. The current number is 3, with the Bears -155 and the Patriots +130, so the implied chance of a Chicago win moved from 54.5% at open to 60.8% now. The spread price tells you the market is leaning further: Bears -3 is -102 while Patriots +3 is -118, which means DraftKings is charging more to take the points than to lay them. ESPN's Matchup Predictor gives Chicago a 59.4% chance, in line with the moneyline.

The total has moved more than the side, from 47.5 to 50.5, with the over now -118. That is a bet on the version of these offenses that showed up lately. Chicago's six games have averaged 44.8 combined points (96, 12, 34, 35, 38 and 54), and two went over 50.5. New England's have averaged 41.5 (23, 23, 41, 55, 62 and 45), also with two over this number. Weather at Soldier Field is forecast at 61 degrees with gusts to 7 mph, per ESPN, so the wind off the lake should not be a factor.

The market's read is that Chicago at home with Williams healthy is a different team from the one that lost to Minnesota and Green Bay, and that the Bears' run game will travel against a Patriots defense that is good but has not seen this volume. The case against it is that New England has the more efficient offense, the hotter quarterback and a red zone edge, and that 3 is a big number to lay in a game the market rated as a pick'em at the open. BetLegend's Featured Game is analysis only; we post no pick here.

Final Thoughts

This is a style matchup. Chicago wants to run the ball, win third downs and keep the clock moving, and it does all three better than New England. The Patriots want to throw, and they are better at it: more yards per attempt, more points per red zone trip, and a quarterback who has turned a shaky start into the best stretch of his career. Injuries tilt the trenches in opposite directions, with New England's offensive line and Chicago's linebackers both short handed.

Watch Chicago's first trip inside the 20. If Swift is finishing drives and the Bears are converting touchdowns, the move to 3 will look right. If Chicago is moving the ball and kicking field goals while Maye keeps hitting explosive throws, this is the kind of game a road team can win outright. Check the inactives for Edwards and Moses, and check the final number before kickoff.

Where Every Number Came From

Every number in this breakdown was read live on October 22, 2026 between 1:45 and 2:30 PM Pacific. Odds, open and current: ESPN game summary pickcenter, DraftKings. Records, points for and against, team leaders, injuries, broadcast, venue, weather and the Matchup Predictor: ESPN game summary for event 401873010. Game by game scores: ESPN team schedules for both clubs. Team passing, rushing, third down, red zone, turnover, sack and possession numbers: ESPN's 2026 regular season team statistics for both clubs. Per game points and yards allowed: the ESPN game summary team statistics. Maye's three game numbers, Williams' Atlanta line and hamstring absence, the series record, the last meeting, against the spread records, the Brown and Johnson matchup, the rushing yards rank, Swift's touchdown note, the Thieneman note and the sack note: the Associated Press preview published on ESPN on October 21. EPA per play and success rate were not available from these sources and are not used.
Frequently Asked Questions

What time is Patriots vs Bears on October 22, 2026?
Thursday, October 22, 2026 at 5:15 PM Pacific (8:15 PM Eastern) at Soldier Field in Chicago, on Prime Video.
What are the betting odds for Patriots vs Bears?
At DraftKings via ESPN, read 2:28 PM Pacific on October 22: Bears -3 at -102 and Patriots +3 at -118 on the spread, Bears -155 and Patriots +130 on the moneyline, and a total of 50.5 with the over -118 and the under -102. The line opened Bears -1.5, Bears -120 and Patriots +100, with a total of 47.5.
What are the records of the Patriots and Bears?
Both teams are 4 and 2. Chicago is 2 and 1 at home and has scored 150 points while allowing 119. New England is 1 and 2 on the road and has scored 136 points while allowing 113.
Who are the key players to watch?
For New England, Drake Maye (1,463 passing yards, 11 touchdowns, 7 interceptions), Rhamondre Stevenson (263 rushing yards), Romeo Doubs (261 receiving yards) and Elijah Ponder (5.5 sacks). For Chicago, Caleb Williams (712 passing yards in three games), D'Andre Swift (398 rushing yards, 6 touchdowns), Luther Burden III (361 receiving yards) and Austin Booker (4 sacks).
Who is injured for Patriots vs Bears?
Per the ESPN injury report: for Chicago, Anthony Johnson Jr. is on injured reserve, Jack Sanborn and Kyle Monangai are out, T.J. Edwards is doubtful and Tyrique Stevenson Sr. is questionable. For New England, Alijah Vera-Tucker is on injured reserve, Ben Brown, Channing Canada and Karon Prunty are out and Morgan Moses is questionable.

Link to this breakdown

NBA | Wednesday, October 21

Warriors vs Lakers On Opening Night: Luka's Lakers Open Without LeBron, Golden State Opens Without Four Rotation Players, And The Line Has Climbed From 5.5 To 6.5

Golden State Warriors at Los Angeles Lakers, NBA season opener on ESPN, Featured Game of the Day

One year ago tonight, Golden State walked into this building and won its opener 119 to 109. The Lakers won the next three meetings, finished 53 and 29, and have rebuilt the roster around Luka Doncic since. Now the rematch opens the season again, and the Warriors arrive without Brandin Podziemski, Jimmy Butler, Moses Moody or Kristaps Porzingis, with Stephen Curry listed probable on a sore right ankle. DraftKings opened the Lakers at 5.5. By Wednesday morning they were 6.5 point favorites.

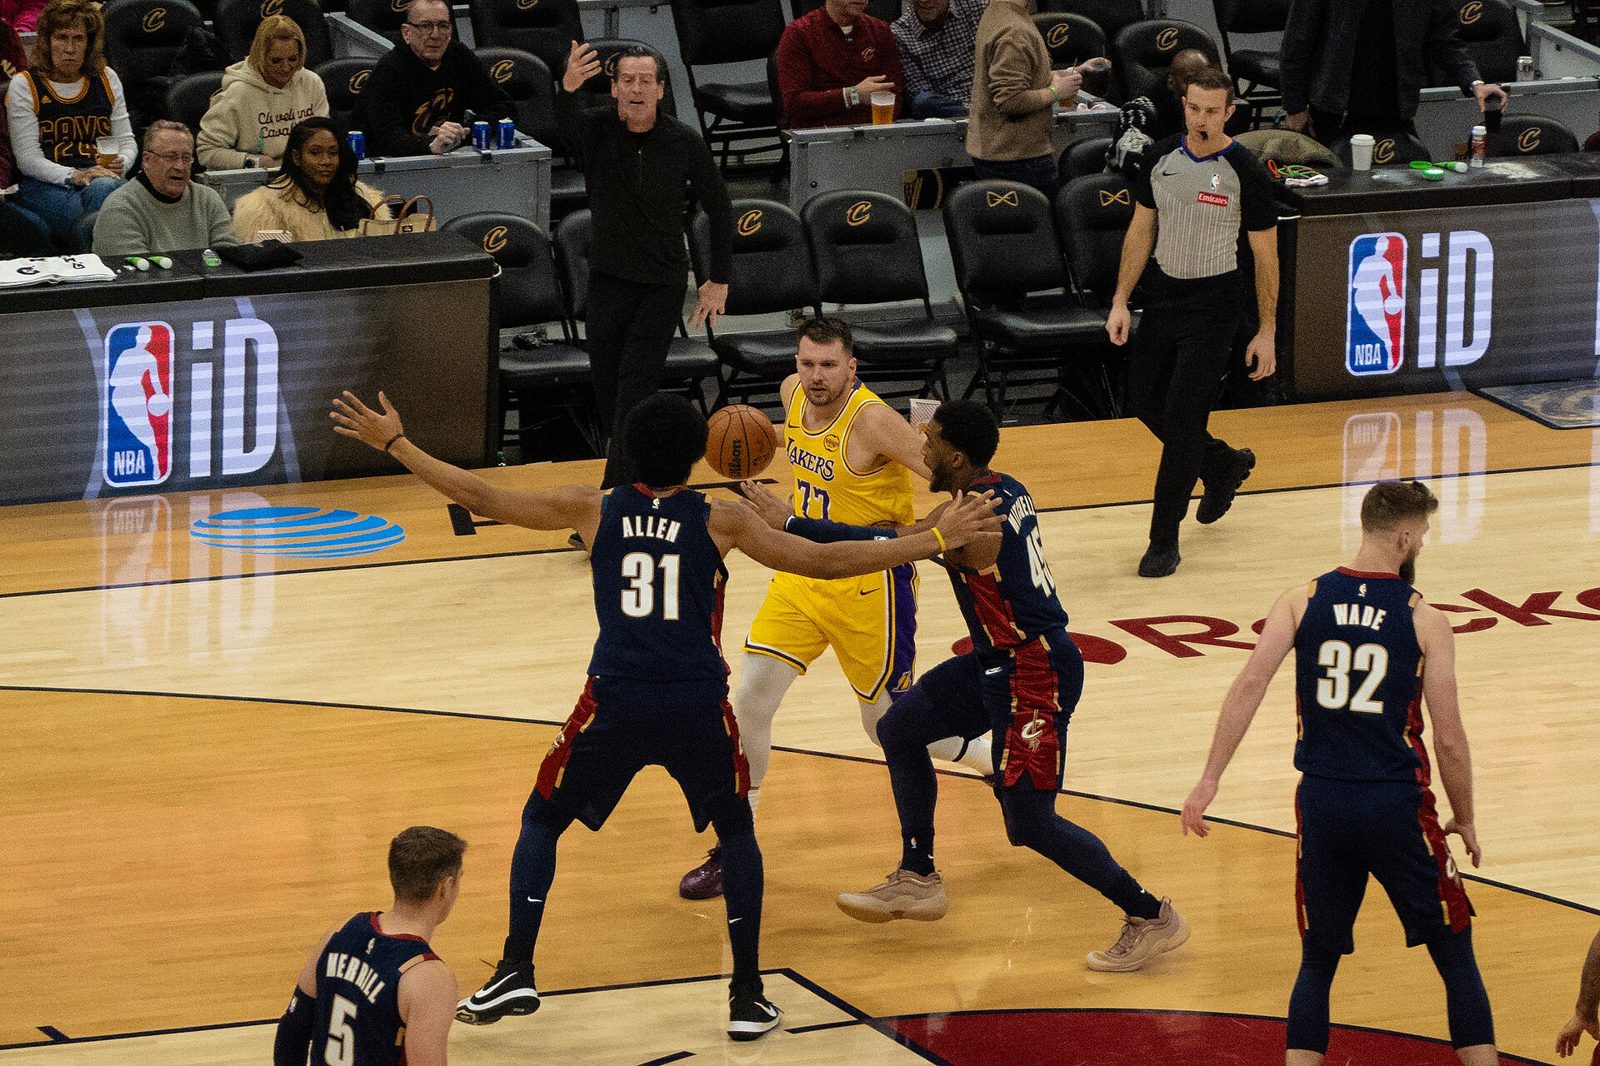
Los Angeles Lakers guard Luka Doncic handles the ball at the top of the floor while Cleveland's Jarrett Allen and Donovan Mitchell defend in January 2026
Luka Doncic (77) brings the ball up against Jarrett Allen (31) and Donovan Mitchell (45) in Cleveland on January 28, 2026 | Photo: Erik Drost, CC BY 4.0, via Wikimedia Commons

Golden State Warriors Warriors vs Lakers Los Angeles Lakers

Wednesday, October 21, 2026 | 7:00 PM PT / 10:00 PM ET | Crypto.com Arena, Los Angeles, CA | ESPN
Season opener for both teams | Last season: Lakers 53, 29 | Warriors 37, 45 | Lakers won the season series 3, 1
Spread
LAL -6.5 (-112) / GS +6.5 (-108)
Moneyline
LAL -230 / GS +190
Total
O/U 233.5 (o -112 / u -108)
Implied Probability
LAL 69.7% / GS 34.5%
Lines: DraftKings via ESPN, read 10:54 AM PT October 21. Opened LAL -5.5 (-110), LAL -205 / GS +170, total 231.5.

Matchup Context

Neither team has played a game that counts yet, so every season number on this page comes from 2025 to 26 and is labelled that way. Last season's opener was this exact matchup in this same building, and Golden State won it 119 to 109. That was the high point of the matchup for the Warriors. The Lakers took the next three meetings, 105 to 99 at home on February 7, then 129 to 101 and 119 to 103 in San Francisco on February 28 and April 9. Season series: Lakers 3, Warriors 1.

The two seasons ended in very different places. The Lakers went 53 and 29, 28 and 13 at home, closed the regular season 16 and 4 over their last 20 games, beat Houston in six in the first round and then got swept by Oklahoma City in the second round. Golden State went 37 and 45, just 15 and 26 on the road, lost seven of its last ten regular season games, won a play in game at the Clippers 126 to 121 and was knocked out in the next one at Phoenix, 111 to 96.

Here's the thing about that Lakers record, though. Basketball Reference's Pythagorean projection, which only looks at points scored and allowed, had them at 45 and 37. A +1.8 net rating is a solid playoff team, not a 53 win team, and eight wins of outperformance usually comes from close game luck that does not carry over. That matters tonight because the market is pricing the Lakers like a team that is clearly better than Golden State, and the season long margin numbers say the gap was real but smaller than the standings.

This is also a different Lakers team. LeBron James, who averaged 20.9 points for Los Angeles last season, is now on Philadelphia's roster, and Deandre Ayton, Rui Hachimura, Marcus Smart and Luke Kennard are not on tonight's Lakers roster either. In their place: Walker Kessler, Quentin Grimes, Collin Sexton, Sandro Mamukelashvili, Ziaire Williams, Matisse Thybulle, Jaden Hardy and Kevon Looney. It is Luka Doncic's team now, and he said as much in a full page ad in the Los Angeles Times on Wednesday, telling the city "tonight we start our run for a championship."

The preseason went Golden State's way, for whatever exhibition games are worth. The Warriors went 4 and 1 and beat the Lakers twice, 124 to 98 on October 6 and 101 to 89 on October 13. The Lakers went 2 and 3 and closed with a 121 to 106 loss to Denver. Exhibition results carry close to zero weight, so treat them as a note on depth, not a verdict.

Injury Report & Lineup Notes

Golden State Warriors
Curry (G) PROBABLE
Stephen Curry, right ankle soreness. Hurt in Sunday's practice; ESPN still carries him as day to day, the official report has him probable.
Podziemski (G) OUT
Brandin Podziemski, low back soreness. He played all 82 games last season at 13.8 points and 5.1 rebounds.
Butler (F) OUT
Jimmy Butler, right ACL repair. Torn January 19; ESPN's Anthony Slater reports a possible return between January and February.
Moody (G) OUT
Moses Moody, left patellar tendon repair. Possible return between December and January.
Porzingis (C) OUT
Kristaps Porzingis, listed as not with team. ESPN reports an undisclosed health issue and no timetable.
Bassey (C) QUESTIONABLE
Charles Bassey, right patellar tendinopathy. Missed practice Tuesday.
Los Angeles Lakers
Carr (G) OUT
Cameron Carr, right oblique strain. Rookie, has not been practicing.
Thiero (F) OUT
Adou Thiero, left knee swelling. Next chance is Friday against the Clippers.
Sexton (G) QUESTIONABLE
Collin Sexton, right soleus strain. Missed all of the preseason but got through the last two practices; ESPN expects a minutes limit if he plays.
Kessler (C) AVAILABLE
Walker Kessler is listed available with a splint on his left finger.
Core rotation
Luka Doncic, Austin Reaves, Quentin Grimes, Jake LaRavia, Jarred Vanderbilt and Jaden Hardy are on the roster and not on the report.

Golden State's report is the story. Butler, Moody and Porzingis were already gone, and Podziemski's back takes out the one rotation guard who played every game last season. That leaves Curry, De'Anthony Melton, Gary Payton II, Will Richard and Brandon Williams to cover the backcourt minutes, and puts a lot of weight on a 38 year old's sore ankle. The probable tag is good news for the Warriors, but a Curry who is limited in any way changes this game more than any other player on either report. The Lakers are close to whole: Carr and Thiero are end of bench pieces, and Sexton is a bonus if he goes. Final availability comes about 30 minutes before tip, so check at 6:30 PM Pacific.

Luka vs A Thin Backcourt, Curry vs A New Lakers Defense

The Lakers offense against the Golden State defense

Doncic was a monster last season: 33.5 points, 8.3 assists and 7.7 rebounds in 64 games, on 47.6% shooting with 10.8 three point attempts a night. Austin Reaves added 23.3 points and 5.5 assists in 51 games. Those two return as the core of an offense that finished ninth in the league at 118.2 points per 100 possessions with the second best effective field goal percentage in the NBA, .573. The Lakers did not need volume from three to get there. They ranked 22nd in three point attempt rate and lived at the rim and the line instead, with a free throw rate of .244 that was well above the league's .206.

That is a tough look for this version of the Warriors. Golden State's defense was middle of the pack last season at 115.6 per 100, and three of the guards and wings who played real minutes for it last season are unavailable: Podziemski is out tonight, Butler and Moody are months away. Draymond Green, now 36, played 68 games at 8.4 points, 5.5 rebounds and 5.5 assists, and Al Horford, 40, gave Golden State 21.5 minutes a night in 45 games. They are smart defenders, but asking that frontcourt to cover Doncic in the pick and roll with Kessler rolling to the rim is a lot. Kessler only played five games for Utah last season, so his role here is a projection, not a track record.

The Golden State offense against the Los Angeles defense

The Warriors' identity did not change, and it is not subtle. Golden State took 49.7% of its shots from three, the highest rate in the league, at 44.1 attempts per game, and made 35.6%. Curry was 26.6 points per game on 39.3% from three with 11.3 attempts in just 43 games. The problem was the 39 games he did not play, and the offense around him only finished 18th at 115.0 per 100.

The Lakers' defense was the weak half of last year's team: 116.4 points allowed per 100 possessions, 19th, with opponents posting a .555 effective field goal percentage, 22nd. That is where the new pieces are supposed to help. Kessler gives Los Angeles a true rim protector, Grimes played 75 games for Philadelphia at 29.4 minutes, and Thybulle and Vanderbilt are defense first wings. How quickly that group can chase Curry off screens on night one is the most important unknown on the Lakers side.

Advanced Stats & Style Profile

Golden State Warriors (2025 to 26)

Record (Pythagorean)37, 45 (40, 42)
Offensive rating (rank)115.0 (18th)
Defensive rating (rank)115.6 (17th)
Net rating-0.6
Pace99.0
Points for / against per game114.6 / 115.2
Effective FG% / opponent eFG%.549 / .553
Three point attempt rate / 3P%.497 / 35.6
Turnover % / offensive rebound %13.8 / 25.8
Free throws per FGA.192

Los Angeles Lakers (2025 to 26)

Record (Pythagorean)53, 29 (45, 37)
Offensive rating (rank)118.2 (9th)
Defensive rating (rank)116.4 (19th)
Net rating+1.8
Pace98.3
Points for / against per game116.3 / 114.6
Effective FG% / opponent eFG%.573 / .555
Three point attempt rate / 3P%.394 / 35.9
Turnover % / offensive rebound %13.2 / 23.9
Free throws per FGA.244

These are last season's regular season numbers from Basketball Reference, because the 2026 to 27 season has no games yet. Ratings are points per 100 possessions and ranks are out of 30. The league average offensive and defensive rating was 115.8 and league average pace was 99.4.

The headline is a 2.4 point gap in net rating, Lakers +1.8 to Warriors -0.6, which is a lot closer than a 16 game gap in the standings. The Lakers' edge was all offense: 3.2 more points per 100 possessions, built on shot quality and free throws rather than threes. Golden State was actually a little better defensively, 115.6 to 116.4, and grabbed more of its own misses, 25.8% to 23.9%. Both teams played slower than average. On the scoring side, all four meetings last season finished under tonight's 233.5: 228, 204, 230 and 222 combined points.

Keys To The Game

Warriors Keys
A full Curry. Probable is not the same as 100%. Golden State needs his 26.6 points and the gravity that comes with 11 threes a night, especially without Podziemski handling the ball.
Make the three ball count. Nobody shot more threes last season. At 35.6% that volume is roughly neutral; a hot night is the Warriors' clearest path to covering or winning outright.
Keep Luka off the line. The Lakers got to the stripe at a .244 rate. Golden State's veteran bigs have to defend without fouling for 48 minutes.
Lakers Keys
Attack the thin backcourt. With Podziemski, Butler and Moody out, Doncic and Reaves should be hunting matchups from the opening possession.
Kessler's first real minutes. Five games last season. If he protects the rim and rolls hard, it fixes the 19th ranked defense and opens the floor for Luka.
Chase Curry off the line. Grimes, Thybulle and Vanderbilt have to run him off screens without giving up open looks to the rest of a three heavy roster.

Market Context

The market has moved one way. DraftKings opened the Lakers as 5.5 point favorites at -110, Lakers -205 and Warriors +170 on the moneyline, with a total of 231.5. The Associated Press preview, filed late on October 19, also listed Lakers -5.5 with a total of 234.5. As of 10:54 AM Pacific Wednesday, the spread is Lakers -6.5 at -112, the moneyline is -230 and +190, and the total is 233.5 with the over at -112. ESPN's Matchup Predictor gives the Lakers a 77.5% chance to win, which is higher than the 69.7% the moneyline implies.

The move fits Golden State's injury news. Podziemski was ruled out and Curry picked up his tag on Tuesday, and the number has climbed a full point since the open. On the total, the move from 231.5 to 233.5 runs against last season's head to head history, since all four meetings finished under 233.5, but those games came with LeBron on the Lakers and with very different Warriors rosters.

So what is the market really saying? It is giving the Lakers credit for the 53 wins, home court and a healthier roster, and it is pricing Golden State like a team that will be leaning hard on Curry. The counterpoint is the margin data: a 2.4 point net rating gap last season, an eight win Pythagorean overperformance by the Lakers, and a Warriors team that beat this Lakers group twice in October exhibitions. Whether 6.5 is the right number mostly depends on how much the new Lakers defense has improved and how healthy Curry's ankle really is.

Final Thoughts

On paper the Lakers are the better team and the healthier team tonight. They have the best player on the floor in Doncic, a top ten offense from last season, home court, and an opponent missing four rotation players. Golden State's case is Curry, the three point volume and a defense that was a touch better than the Lakers' last season. The margin numbers say this matchup was closer than the standings, and the injury report says it might not be tonight.

Two things to watch early: how Curry is moving in the first few minutes, and whether Kessler is changing shots at the rim. If Curry looks normal and the Warriors are hitting threes, this is the kind of game a 6.5 point line can underrate. If Luka is getting downhill against Golden State's backup guards and Kessler is cleaning up the glass, the new Lakers will look every bit like the team the market thinks they are.

Where Every Number Came From

Every number in this breakdown was read live on October 21, 2026 between 10:45 and 10:55 AM Pacific. Odds, open and current: ESPN game summary pickcenter and scoreboard, DraftKings. Game time, venue, broadcast, preseason results, the Matchup Predictor and the AP preview: ESPN game summary for this game. Injuries: the official NBA injury report filed 1:45 PM Eastern on October 21, plus ESPN's injury feed for context. Rosters: ESPN team rosters. Last season's records, Pythagorean records, offensive, defensive and net ratings, pace, four factors, per game team stats, player per game stats, head to head results and playoff results: Basketball Reference 2025 to 26 league, team schedule and playoff pages. The Luka Doncic quote is from ESPN's news feed for this game. Implied probability is BetLegend's math from the moneyline. Analysis only, no pick.

Frequently Asked Questions

What time is Warriors vs Lakers on October 21, 2026?
Wednesday, October 21, 2026 at 7:00 PM Pacific (10:00 PM Eastern) at Crypto.com Arena in Los Angeles, on ESPN. It is the season opener for both teams.
What are the betting odds for Warriors vs Lakers?
At DraftKings via ESPN, read 10:54 AM Pacific on October 21: Lakers -6.5 at -112 and Warriors +6.5 at -108 on the spread, Lakers -230 and Warriors +190 on the moneyline, and a total of 233.5 with the over -112 and the under -108. The line opened Lakers -5.5, Lakers -205 and Warriors +170, with a total of 231.5.
Is Stephen Curry playing against the Lakers?
The official NBA injury report filed at 1:45 PM Eastern on October 21 lists Stephen Curry as probable with right ankle soreness. Brandin Podziemski (low back soreness), Jimmy Butler (right ACL repair), Moses Moody (left patellar tendon repair) and Kristaps Porzingis (not with team) are out, and Charles Bassey is questionable.
What were the Warriors and Lakers records last season?
The Lakers went 53 and 29 in the 2025 to 26 regular season, beat Houston 4 games to 2 in the first round and were swept by Oklahoma City in the second round. Golden State went 37 and 45, won a play in game at the Clippers and was eliminated in a play in game at Phoenix. The Lakers won three of the four regular season meetings.
Who are the key players to watch?
For the Lakers, Luka Doncic (33.5 points, 8.3 assists and 7.7 rebounds per game last season) and Austin Reaves (23.3 points per game), plus newcomers Walker Kessler and Quentin Grimes. For Golden State, Stephen Curry (26.6 points per game, 39.3% from three last season), Draymond Green, Al Horford and De'Anthony Melton.
Who is injured for the Lakers?
Per the official NBA injury report at 1:45 PM Eastern on October 21: Cameron Carr (right oblique strain) and Adou Thiero (left knee swelling) are out, Collin Sexton (right soleus strain) is questionable, and Walker Kessler is available while wearing a splint on his left finger.

Link to this breakdown

NBA | Tuesday, October 20

Thunder vs Spurs On Opening Night: The West Finals Rematch Opens The 2026 to 27 Season, And The Favorite Has Flipped From San Antonio To Oklahoma City

Oklahoma City Thunder at San Antonio Spurs, NBA season opener on NBC, Featured Game of the Day

The last time these two teams shared a floor, San Antonio was closing out a seven game West finals in Oklahoma City, 111 to 103 on May 31. Victor Wembanyama averaged 27.3 points and 10.9 rebounds in that series, the Spurs went on to lose the Finals to the Knicks in five, and the Thunder went home a year after winning the title. Now the season opens with the exact rematch in San Antonio. DraftKings opened the Spurs as 1.5 point home favorites. By Tuesday afternoon the number had flipped to Oklahoma City by 1.5, and that move is the first betting story of the new season.

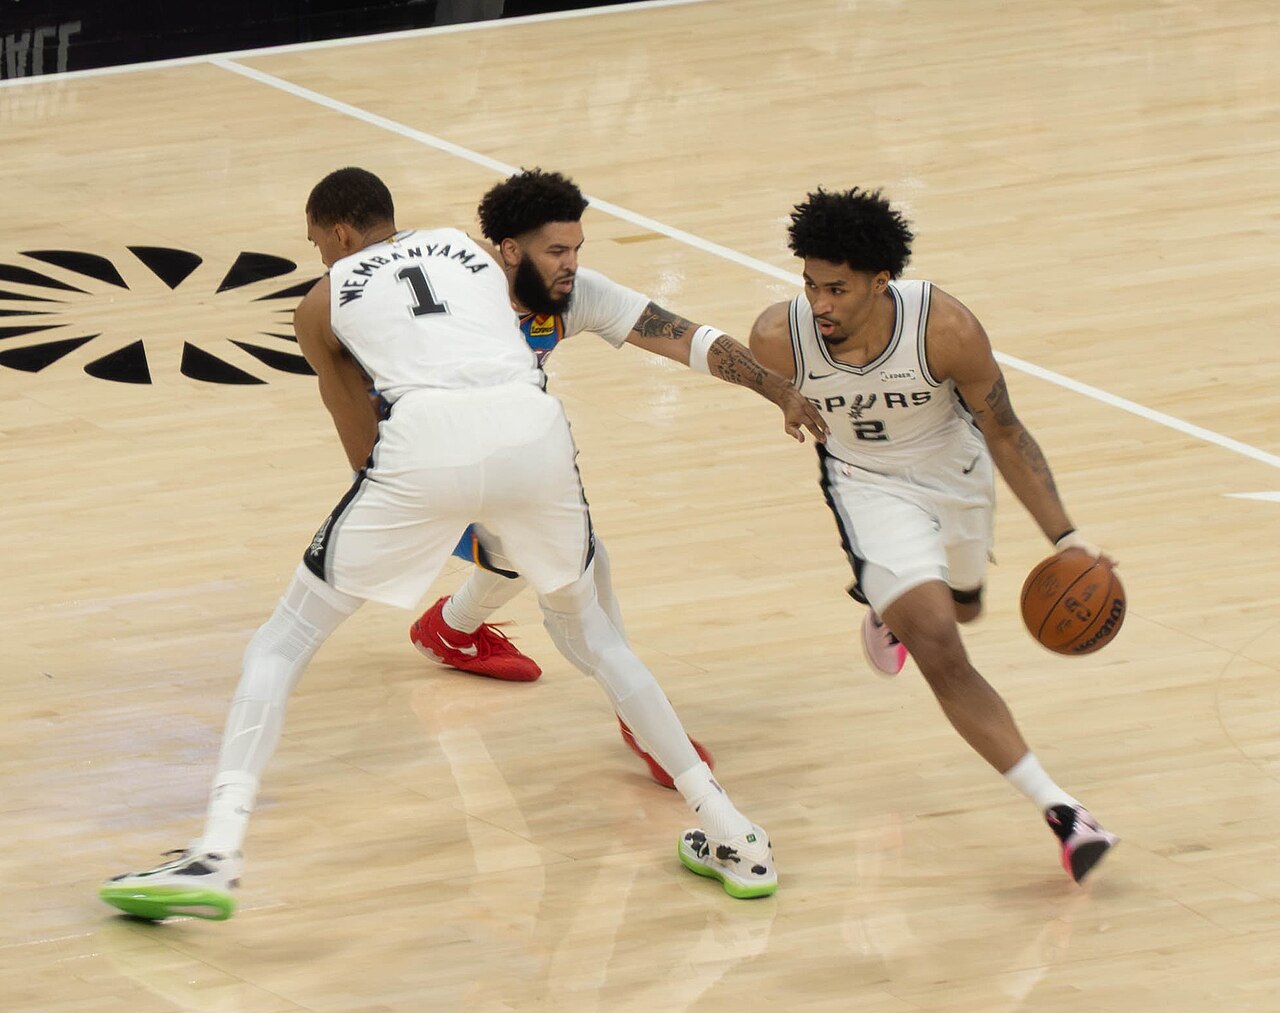
San Antonio Spurs guard Dylan Harper drives with the ball as Victor Wembanyama sets a screen on an Oklahoma City Thunder defender during the 2026 West finals
Dylan Harper (2) drives off a Victor Wembanyama (1) screen against the Thunder in San Antonio during the 2026 West finals | Photo: Petsbikes, CC BY-SA 4.0, via Wikimedia Commons

Oklahoma City Thunder Thunder vs Spurs San Antonio Spurs

Tuesday, October 20, 2026 | 6:30 PM PT / 9:30 PM ET | Frost Bank Center, San Antonio, TX | NBC
Season opener for both teams | Last season: Thunder 64, 18 | Spurs 62, 20 | Spurs won the 2026 West finals 4, 3
Spread
OKC -1.5 (-105) / SA +1.5 (-115)
Moneyline
OKC -115 / SA -105
Total
O/U 230.5 (o -115 / u -105)
Implied Probability
OKC 53.5% / SA 51.2%
Lines: DraftKings via ESPN, read 12:57 PM PT October 20. Opened SA -1.5 (-115), SA -125 / OKC +105, total 228.5.

Matchup Context

Neither team has played a game that counts yet, so every season number on this page is from 2025 to 26. That is not a limitation here, it is the whole point. These were the two best teams in the West last year. Oklahoma City went 64 and 18 and San Antonio went 62 and 20. The NBA put the rematch on NBC as the late game of its opening night tripleheader, and it is easy to see why.

San Antonio has owned this matchup for a year. The Spurs won four of the five regular season meetings: 111 to 109 in the NBA Cup semifinal in Las Vegas on December 13, then 130 to 110 at home on December 23 and 117 to 102 in Oklahoma City on Christmas Day. Oklahoma City's only win was 119 to 98 at home in January, and the Spurs took the last one, 116 to 106 in San Antonio on February 4.

Then came the West finals, and they were as close as the seedings suggested. San Antonio stole Game 1 in Oklahoma City 122 to 115 in double overtime, a night when Wembanyama finished with 41 points and 24 rebounds. The Thunder answered with three wins in four games, 122 to 113, 123 to 108 in San Antonio, and 127 to 114 at home in Game 5, around a 103 to 82 Spurs blowout in Game 4. Facing elimination, San Antonio won Game 6 118 to 91 and Game 7 111 to 103 on the Thunder's floor. Across seven games the Spurs outscored Oklahoma City by 26 points total. Counting the playoffs, San Antonio is 8 and 4 against the Thunder over the last 12 meetings.

The two teams took very different roads out of the summer, at least on the exhibition scoreboard. The Spurs went 2 and 3 in the preseason but closed with home wins over Phoenix (123 to 103) and Sacramento (126 to 97). The Thunder went 1 and 4, with their only win in overtime against Indiana and a 116 to 89 loss in Houston last week. Preseason results carry close to zero weight for a veteran rotation, but they are the only 2026 to 27 games either team has played.

Injury Report & Lineup Notes

Oklahoma City Thunder
Sorber (C) OUT
Thomas Sorber, knee, listed out by ESPN in an update on October 19.
Topic (G) OUT
Nikola Topic, back, listed out in an update on October 19.
Oweh (G) OUT
Otega Oweh, Achilles, listed out. The Associated Press preview on ESPN says he is out for the season.
Core rotation
Shai Gilgeous-Alexander, Jalen Williams, Chet Holmgren, Isaiah Hartenstein, Ajay Mitchell, Alex Caruso, Cason Wallace and Jared McCain are all on the roster and none is on the injury report.
San Antonio Spurs
Harris (F) OUT
Tobias Harris, calf, listed out by ESPN in an update on October 19. He averaged 13.3 points and shot 36.8% from three last season.
Quaintance (F) OUT
Jayden Quaintance, knee, listed out.
Core rotation
Victor Wembanyama, De'Aaron Fox, Stephon Castle, Dylan Harper, Devin Vassell, Keldon Johnson, Julian Champagnie and Harrison Barnes are on the roster and none is on the injury report.

This is about as clean as an opening night injury report gets for two contenders. Every Thunder absence is a young player outside the main rotation, and the Spurs lose Harris, a veteran forward who would have been part of the frontcourt mix behind Wembanyama. That puts more minutes on Keldon Johnson, who played all 82 games last season at 13.2 points on 51.9% shooting, and on Julian Champagnie, who scored 22 in Game 5 and 20 in Game 7 against Oklahoma City. Note that the AP preview, filed late on October 18, listed no Spurs injuries; Harris was added on the ESPN report the next day. Check final availability about 30 minutes before tip, 6:00 PM Pacific.

Wembanyama vs The Thunder, Shai vs The Spurs

The San Antonio offense against the Oklahoma City defense

Wembanyama is the matchup, and the numbers from the last meeting are not subtle. He averaged 25.0 points, 11.5 rebounds and 3.1 blocks in 64 regular season games last year in just 29.2 minutes a night, then put up 27.3 points, 10.9 rebounds and 2.7 blocks per game in the West finals. Six of his seven games in that series went for 21 points or more. The one real dent Oklahoma City put in him came in Game 5, when he shot 4 of 15, and the Thunder won that game by 13.

The reason San Antonio got past Oklahoma City is that the Spurs did not need Wembanyama to do it alone. Stephon Castle averaged 18.0 points in the series after a regular season of 16.7 points and 7.4 assists, Devin Vassell added 13.9 a game, Dylan Harper chipped in 12.0 with 5.7 rebounds, and Champagnie gave them 11.9. Fox, who averaged 18.6 points and 6.2 assists in 72 games last season, missed the first two games of the series and played the last five. That depth matters against a Thunder defense that allowed just 107.9 points per game last season, the stingier of the two by more than three and a half points.

The Oklahoma City offense against the San Antonio defense

Shai Gilgeous-Alexander was outrageous again last season: 31.1 points per game on 55.3% shooting, 38.6% from three and 87.9% at the line. San Antonio held him to 25.9 a game in the West finals, and the shooting tells the story. He shot 40% or worse from the field in five of the seven games, including 7 of 23 in Game 1 and 6 of 18 in Game 6, before a 35 point, 12 of 21 Game 7 that came in a loss. With Wembanyama protecting the rim behind the point of attack, the Spurs made him a volume scorer rather than an efficient one for most of the series.

The bigger Thunder question last spring was who else would score. Jalen Williams played only 33 regular season games last year and appeared in just three of the seven West finals games, scoring 26 in Game 1 and then 4 and 1 in his other two appearances. Oklahoma City filled the gap with guards: Alex Caruso averaged 14.9 points in the series, including 31 in Game 1, and Jared McCain added 13.1. A healthy Williams, who averaged 17.1 points and 5.5 assists last season, is the single biggest difference between this Thunder team and the one that lost Game 7. Chet Holmgren (17.1 points, 8.9 rebounds, 1.9 blocks last season) is the other piece; he averaged only 10.7 points in the series against Wembanyama.

Advanced Stats & Style Profile

Oklahoma City Thunder (2025 to 26)

Record64, 18
Offensive rating (points per 100 possessions)116.3
Defensive rating105.4
Net rating+10.9
Pace (ESPN pace factor)101.7
Points for / against per game119.0 / 107.9
Effective FG% / true shooting %56.1 / 59.9
Three point % / attempts per game36.5 / 37.9
Offensive rebound rate22.3
Turnovers / steals per game12.0 / 9.7

San Antonio Spurs (2025 to 26)

Record62, 20
Offensive rating (points per 100 possessions)116.6
Defensive rating108.5
Net rating+8.1
Pace (ESPN pace factor)102.5
Points for / against per game119.8 / 111.5
Effective FG% / true shooting %55.9 / 59.5
Three point % / attempts per game35.9 / 37.9
Offensive rebound rate26.2
Turnovers / steals per game12.6 / 7.5

The 2026 to 27 season has no games yet, so these are last season's regular season numbers. Offensive, defensive and net ratings are BetLegend's calculation from ESPN's season totals: points scored and points allowed divided by ESPN's possession count for each team. Pace is ESPN's pace factor as reported. On those numbers the two offenses were nearly identical, 116.6 for San Antonio and 116.3 for Oklahoma City, with matching effective field goal percentages and the exact same 37.9 three point attempts per game. The separation was on defense: the Thunder allowed about 3.1 fewer points per 100 possessions, which is why their net rating was close to three points better.

The style split shows up in the details. Oklahoma City forced the issue with 9.7 steals per game to San Antonio's 7.5. The Spurs answered on the glass, with a 26.2 offensive rebound rate to the Thunder's 22.3 and 47.0 rebounds per game to 44.1, and they assisted more, 28.1 assists per game to 25.8. San Antonio also played a touch faster. In the head to head matchups, the Spurs' size won out more often than the Thunder's pressure did, but over a full season Oklahoma City was the better team by every margin measure here.

Keys To The Game

Thunder Keys
Get Shai to his spots without Wembanyama there first. He shot 40% or worse in five of the seven West finals games. Efficient Shai is a different Thunder team than the one that shot its way out of Game 7.
Second creator. Jalen Williams barely played in the series. If he gives Oklahoma City something close to his 17.1 points and 5.5 assists, the Spurs lose the matchup edge they had in May.
Win the turnover battle. 9.7 steals a game was the Thunder's best weapon last season. Live ball turnovers are how a road team takes an opening night crowd out of the building.
Spurs Keys
Wembanyama's minutes. He played 29.2 minutes a game last season. Opening night with a full summer of rest is the one night his workload should not be a question.
Own the offensive glass. A 26.2 offensive rebound rate against Oklahoma City's 22.3 is the cleanest statistical edge San Antonio carries into this game.
Backcourt without Harris up front. Fox, Castle and Harper combined for 47.1 points per game last season. With Harris out, more of the scoring load sits with them and Johnson.

Market Context

The line is the most interesting thing about this game before tip. DraftKings opened San Antonio as a 1.5 point favorite at home, Spurs -125 and Thunder +105 on the moneyline, and the Associated Press preview filed late on October 18 listed the Spurs by 2.5 with a total of 231.5. As of 12:57 PM Pacific on game day, the favorite has flipped: Oklahoma City is -1.5 at -105, with the Thunder -115 and the Spurs -105 on the moneyline. In implied probability that is a move from roughly 55.6% for San Antonio at open to 51.2% now, with Oklahoma City going from 48.8% to 53.5%. ESPN's Matchup Predictor still leans the other way, giving the Spurs a 52.6% chance to win.

The total has gone up as well, from 228.5 at open to 230.5, with the over priced at -115. History between these two is mixed on that number. All five regular season meetings last year finished under 230.5 except the 130 to 110 game on December 23 (240 combined points); the others landed at 220, 219, 217 and 222. In the West finals four of seven games went over 230.5 (237, 235, 231 and 241), but one of those needed two overtimes, and the two elimination games finished at 209 and 214. Both teams averaged about 119 points a game last year, so the number is roughly what their season scoring would suggest before you account for how much better each defense played against the other.

What the move says is that the market is giving Oklahoma City's full season body of work, the 64 wins and the better defensive and net rating, more weight than San Antonio's 8 and 4 run in the last 12 meetings and the home floor. The case for the opening number is just as clear: the Spurs beat this team in a seven game series without Fox for two of the games, and they are at home with the full core available. Whether a flip of three points in the market is the right correction or an overreaction to the Thunder's championship pedigree is the question each bettor has to answer. BetLegend's Featured Game is analysis only; we post no pick here.

Final Thoughts

On a season of evidence, Oklahoma City was the better team: more wins, a defense that allowed more than three fewer points per 100 possessions, a net rating close to three points higher and a 31 point a game scorer in Gilgeous-Alexander. On a matchup of evidence, San Antonio has had the answer: eight wins in the last 12 meetings, a Game 7 win in Oklahoma City, and a big man in Wembanyama who turned Shai's series into a grind.

The two things to watch early are Jalen Williams and the glass. If Williams is a real second creator again, the Thunder have something they did not have in May. If the Spurs are winning the offensive rebound battle and Wembanyama is changing shots at the rim, this looks a lot like Games 6 and 7. Opening night always comes with rust and short rotations, and a line that sits under two points either way is the market saying this game is a coin flip. Check final availability before tip, and check the number one more time; it has already flipped sides since it opened.

Where Every Number Came From

Every number in this breakdown was read live on October 20, 2026 between 12:45 and 1:00 PM Pacific. Odds, open and current: ESPN game summary pickcenter and scoreboard, DraftKings. Game time, venue, broadcast, injuries, preseason results, the Matchup Predictor and the AP preview: ESPN game summary for event 401909090. Last season records, the regular season meetings and points allowed: ESPN's 2025 to 26 team schedules for both clubs. Points, possessions, pace factor, shooting, rebounding, turnover and steal numbers: ESPN's 2025 to 26 regular season team statistics; offensive, defensive and net ratings are calculated from those totals. Player season averages: ESPN's 2025 to 26 player statistics. West finals results and per game player lines: ESPN box scores of all seven games. Rosters: ESPN team rosters. Official NBA.com advanced ratings could not be reached and are not used.

Frequently Asked Questions

What time is Thunder vs Spurs on October 20, 2026?
Tuesday, October 20, 2026 at 6:30 PM Pacific (9:30 PM Eastern) at Frost Bank Center in San Antonio, Texas, on NBC. It is the season opener for both teams.
What are the betting odds for Thunder vs Spurs?
At DraftKings via ESPN, read 12:57 PM Pacific on October 20: Thunder -1.5 at -105 and Spurs +1.5 at -115 on the spread, Thunder -115 and Spurs -105 on the moneyline, and a total of 230.5 with the over -115 and the under -105. The line opened Spurs -1.5 at -115, Spurs -125 and Thunder +105, with a total of 228.5.
Who won the 2026 West finals between the Thunder and Spurs?
San Antonio won the series 4 games to 3, taking Game 7 111 to 103 in Oklahoma City on May 31, 2026. The Spurs then lost the Finals to the New York Knicks, 4 games to 1.
What were the Thunder and Spurs records last season?
Oklahoma City went 64 and 18 in the 2025 to 26 regular season and San Antonio went 62 and 20. San Antonio won four of the five regular season meetings, including the NBA Cup semifinal in Las Vegas.
Who are the key players to watch?
For San Antonio, Victor Wembanyama (25.0 points, 11.5 rebounds and 3.1 blocks per game last season), De'Aaron Fox, Stephon Castle and Dylan Harper. For Oklahoma City, Shai Gilgeous-Alexander (31.1 points per game on 55.3% shooting last season), Jalen Williams, Chet Holmgren and Isaiah Hartenstein.
Who is injured for Thunder vs Spurs?
Per the ESPN injury report on October 20: for San Antonio, Tobias Harris (calf) and Jayden Quaintance (knee) are out. For Oklahoma City, Thomas Sorber (knee), Nikola Topic (back) and Otega Oweh (Achilles) are out.

Link to this breakdown

NFL | Monday, October 19

Commanders vs 49ers on Monday Night Football: Unbeaten San Francisco Hosts A Washington Team Still Shaking Off A Tie, And The Line Has Climbed From 5.5 To 7.5

Washington Commanders at San Francisco 49ers, NFL Week 6, Monday Night Football, Featured Game of the Day

San Francisco is 5 and 0 and has scored at least 24 points in every game. Washington is 1 and 3 with a tie, and the tie stings: last week the Commanders had the ball inside the Giants 30 in overtime and let the clock run out without attempting a kick. Jayden Daniels is back at quarterback after Washington played two games without him, and he ran for 103 yards and two touchdowns in that game. DraftKings opened the 49ers as 5.5 point favorites. The number is now 7.5, through both 6 and 7, and that move is the story of this game in the betting market.

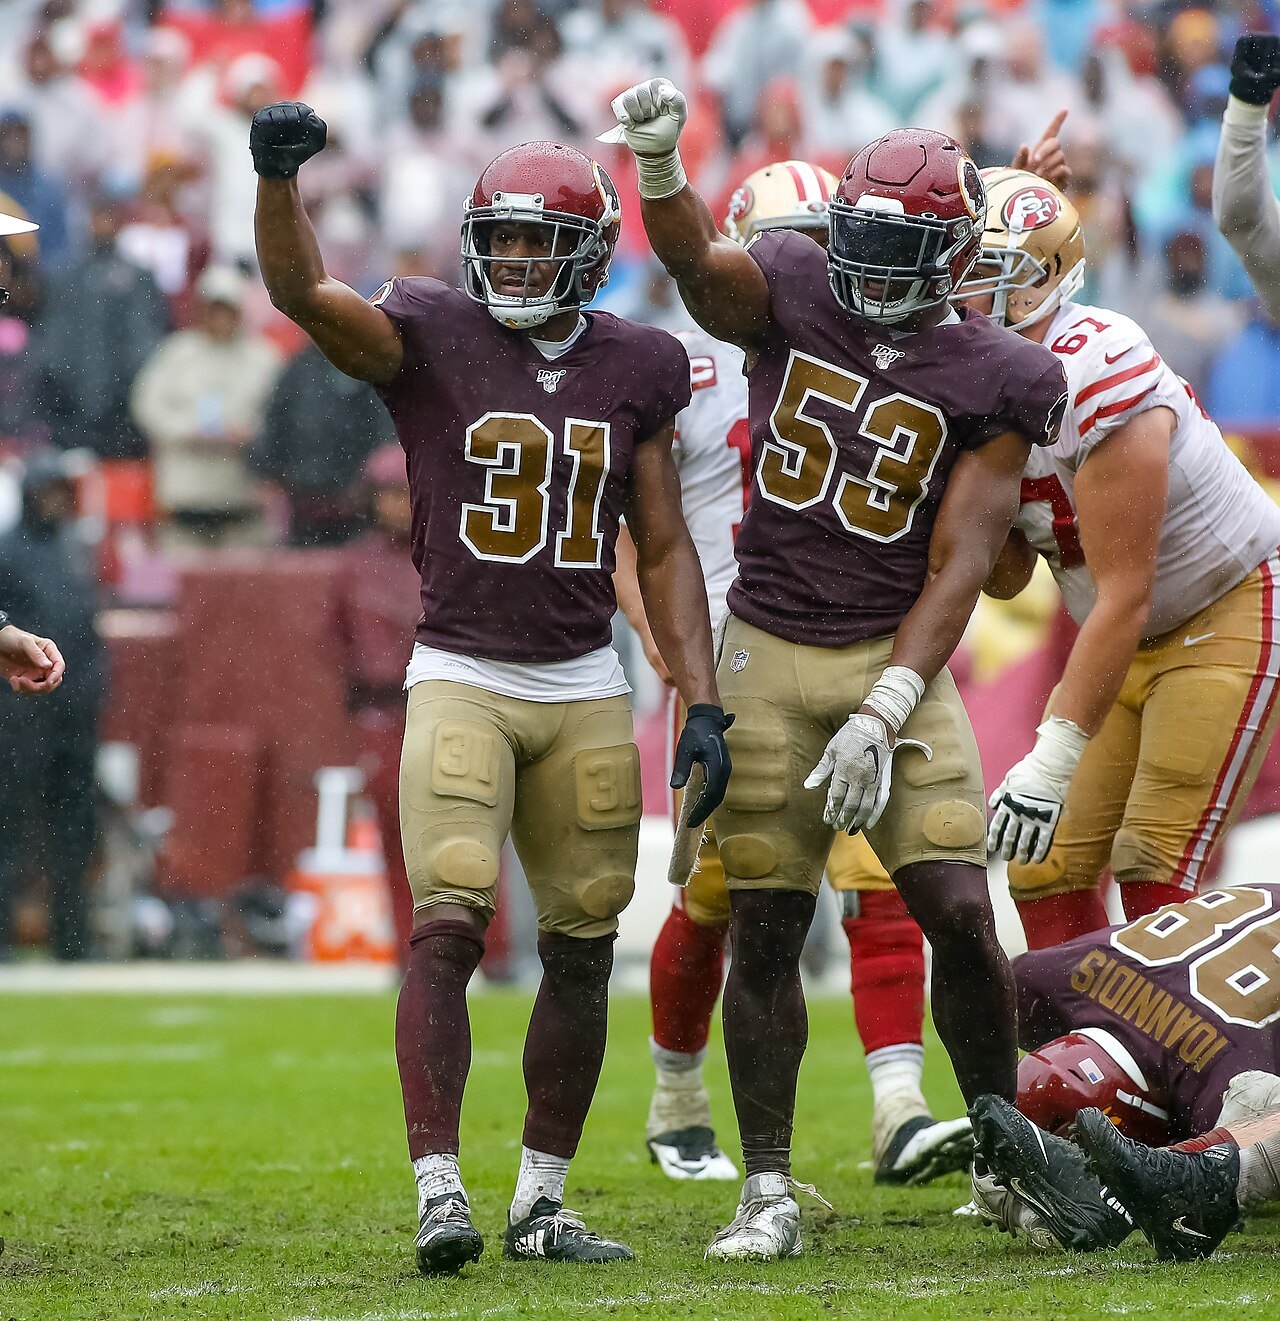
Washington defensive back Fabian Moreau and linebacker Jon Bostic raise their fists after a stop against the San Francisco 49ers, with 49ers offensive lineman Justin Skule behind them
Washington's Fabian Moreau (31) and Jon Bostic (53) celebrate a defensive stop against the 49ers in the rain at Landover, Maryland on October 20, 2019 | Photo: All-Pro Reels, CC BY-SA 2.0, via Wikimedia Commons

Washington Commanders Commanders vs 49ers San Francisco 49ers

Monday, October 19, 2026 | 5:15 PM PT / 8:15 PM ET | Levi's Stadium, Santa Clara, CA | ESPN, ABC
NFL Week 6 | 49ers 5, 0 | Commanders 1, 3, 1 | 49ers lead the all time series 23, 12, 1
Spread
WSH +7.5 (-112) / SF -7.5 (-108)
Moneyline
WSH +310 / SF -395
Total
O/U 51.5 (o -115 / u -105)
Implied Probability
WSH 24.4% / SF 79.8%
Lines: DraftKings via ESPN, read 9:04 AM PT October 19. Opened SF -5.5 (-110), SF -250 / WSH +205, total 50.5 (-110 both ways).

Matchup Context

These two teams arrive at the Monday night window from opposite ends of the standings. San Francisco is 5 and 0, 3 and 0 at Levi's Stadium, and two and a half games clear of Seattle in the NFC West. The 49ers have scored 154 points and allowed 93, a plus 61 differential, and they have not been held under 24 points in any game. Washington is 1 and 3 with a tie, last in the NFC East, 0 and 2 away from home, and has been outscored 149 to 115. On paper this is a mismatch, and the market is pricing it like one.

The paper does not tell the whole story, though. Two of San Francisco's wins were tight: 36 to 30 over Arizona in Week 3 and 32 to 29 in Seattle last week. The other three, over the Rams, Dolphins and Broncos, came by 20, 22 and 10 points. Washington's losses, meanwhile, came in two very different shapes: close ones at Philadelphia (24 to 22) and a tie with the Giants, and lopsided ones at Dallas (37 to 20) and against Indianapolis in London (30 to 13). The one win was a 33 to 31 shootout with Seattle.

The quarterback situation explains a lot of that. Daniels played the first two games, then sat out the Seattle and Indianapolis games, with Marcus Mariota and Athan Kaliakmanis handling the passing in his absence. Daniels came back against the Giants and was the best player on the field: 17 of 25 for 199 yards, plus 103 rushing yards and two rushing touchdowns on nine carries. Per the Associated Press preview on ESPN, he became the first quarterback with multiple touchdown runs of 25 yards or more in the same game since Michael Vick in 2002. Then the Commanders let the clock expire in overtime with the ball inside the New York 30, and a likely win turned into a 27 to 27 tie. Dan Quinn took the blame publicly this week.

History is on San Francisco's side as well. The 49ers lead the all time series 23 wins to 12 with one tie, won the last meeting 27 to 10 on December 31, 2023 in Landover, and Washington has never won at Levi's Stadium, per the AP. None of that decides a football game in 2026, but it frames how lopsided the expectation is coming in.

Injury Report & Lineup Notes

Washington Commanders
Diggs (WR) QUESTIONABLE
Stefon Diggs, hamstring, listed questionable by ESPN in an update dated October 17.
Omenihu (DE), Jean-Baptiste (LB) OUT
Charles Omenihu (groin) and Javontae Jean-Baptiste (pectoral), both listed out.
Amos (CB), McNichols (RB) IR
Trey Amos (ankle) and Jeremy McNichols (quadriceps) are on injured reserve.
Quarterback
Jayden Daniels is not on the injury report. He led Washington in passing and rushing against the Giants last week.
San Francisco 49ers
Evans (WR) QUESTIONABLE
Mike Evans, ribs, questionable per ESPN in an update this morning. He leads the team with 326 receiving yards.
Sigle (S) OUT
Marques Sigle is out with an ankle injury.
Williams (DE), Stout (CB) QUESTIONABLE
Mykel Williams (knee) and Upton Stout (shoulder), both questionable.
Kirk (WR) IR
Christian Kirk (calf) is on injured reserve.

The two names that matter most for this number are receivers. Evans is the 49ers' leading receiver at 24 catches, 326 yards and 3 touchdowns, and with Kirk already on injured reserve, a missed game from Evans would thin out Purdy's options. Diggs is Washington's question mark, and on an offense that has completed just 58.6% of its passes, losing a veteran target matters. On defense, Washington is without Omenihu off the edge, which is not ideal against a line that has allowed only three sacks all year. Check final inactives about 90 minutes before kickoff, 3:45 PM Pacific.

Daniels vs The 49ers, Purdy vs Washington

Washington offense against the San Francisco defense

Everything Washington does well starts with Daniels' legs. In three games he has run 21 times for 203 yards and two scores, and the Commanders as a team average 4.7 yards per carry and 139.6 rushing yards per game. Take the quarterback runs out and the picture gets thinner: Jacory Croskey-Merritt leads the backs with 239 yards on 67 carries, 3.6 per attempt. The passing game has been the weak link all year. Washington has completed 58.6% of its passes at 6.1 yards per attempt, 5.5 net once sacks are counted, and it has taken 10 sacks. Daniels himself has been clean with the ball, with no interceptions in his three appearances, and the team has only two giveaways all season.

San Francisco's defense is built to make that a hard way to live. The 49ers allow 97.6 rushing yards per game and, per the AP, have given up just 33 rushing yards to quarterbacks all season, second fewest in the league. That number came against quarterbacks who are not Daniels, which is the real test on Monday night. Fred Warner leads the team with 50 tackles, Keion White has 3 of the team's 11 sacks, and cornerback Renardo Green picked off two passes in Seattle last week. Washington's third down offense converts only 31.88% of the time, so if San Francisco can win first and second down and force Daniels to throw from obvious passing downs, the Commanders' drives will stall.

San Francisco offense against the Washington defense

Brock Purdy is playing at a very high level. He has completed 98 of 142 passes for 1,196 yards, 13 touchdowns and 2 interceptions, and the 49ers average 8.4 yards per pass attempt with a 119.3 team passer rating. Per the AP, Purdy is five attempts away from qualifying for the all time passer rating leaderboard, where his career 105.4 would rank first. Christian McCaffrey has 286 rushing yards and 5 touchdowns on 61 carries, and the 49ers convert 51.92% of their third downs. Purdy has been sacked only three times. That is an offense that stays on schedule.

Washington's defense has had trouble with exactly that kind of offense. The Commanders allow 29.8 points and 364.2 yards per game, including 268.8 through the air. The AP notes they have allowed an NFL worst 95 second half points, which means 95 of the 149 points scored on them came after halftime, and they have allowed touchdowns on a league worst 83.3% of opponent red zone trips. San Francisco scores touchdowns on 87.5% of its own red zone trips, the best rate in the league per the AP. When the 49ers get inside the 20, this matchup gives Washington little reason to expect a field goal.

Advanced Stats & Style Profile

Washington Commanders (2026)

Record / points for and against1, 3, 1 / 115 and 149
Yards per play (ESPN total yards / offensive plays)5.3 (1,683 / 320)
Yards per pass attempt / net6.1 / 5.5
Yards per rush4.7
Third down conversion31.88%
Red zone TD % / scoring %50.00% / 91.67%
Giveaways / takeaways / margin2 / 7 / +5
Sacks allowed / sacks made10 / 9
Yards allowed per game364.2

San Francisco 49ers (2026)

Record / points for and against5, 0 / 154 and 93
Yards per play (ESPN total yards / offensive plays)6.5 (1,839 / 284)
Yards per pass attempt / net8.4 / 8.2
Yards per rush4.6
Third down conversion51.92%
Red zone TD % / scoring %87.50% / 100.00%
Giveaways / takeaways / margin5 / 7 / +2
Sacks allowed / sacks made3 / 11
Yards allowed per game308.4

EPA per play and success rate were not available from the sources read for this article, so the efficiency picture here is built from ESPN's season team statistics, labelled exactly as ESPN reports them, with yards per play calculated from ESPN's total yards and offensive plays. The gap is clear anyway. San Francisco gains more than a full yard per play more than Washington, 6.5 to 5.3, and the passing efficiency gap is wider still, 8.2 net yards per attempt against 5.5. The 49ers convert third downs 20 percentage points more often and finish red zone trips with touchdowns at a much higher rate.

Washington's one clear statistical edge is ball security. The Commanders have only two giveaways and a plus 5 turnover margin, tied for second in the league per the AP. San Francisco has five giveaways, three of them lost fumbles. Washington also runs more plays (320 to 284 over the same five games) and holds the ball longer, about 31 minutes per game to San Francisco's 28 and a half, which is how a team with worse efficiency stays in games. That formula, shorten the game, protect the ball and steal a possession, is the only realistic path for an underdog of this size.

Keys To The Game

Commanders Keys
Daniels has to create outside the structure. His 9.7 yards per carry this season is the most efficient part of this offense. If the 49ers keep him in the pocket, Washington's 6.1 yards per attempt passing game has to carry the load.
Stay out of third and long. A 31.88% third down rate against a defense with 11 sacks is a bad combination. Early down success decides how many possessions Washington gets.
Hold up after halftime. 95 of the 149 points Washington has allowed came in the second half.
49ers Keys
Contain the quarterback. The 49ers have allowed only 33 quarterback rushing yards all year, but they have not seen a runner like Daniels. Rush lane discipline matters more than sacks.
Win early downs with McCaffrey. The offense converts 51.92% on third down because it lives in short yardage. Keep doing that and Purdy's 8.4 yards per attempt does the rest.
Kicking. Per the AP, Eddy Pineiro has missed three field goals and two extra points. In a game with a 7.5 spread, a missed kick is the kind of thing that changes the cover math.

Market Context

This is the most important number on the page. DraftKings opened San Francisco at 5.5 with Washington +205 on the moneyline, and the current price is 7.5, with the 49ers -395 and the Commanders +310. That is a two point move through both 6 and 7, two of the most common margins in the NFL, and the moneyline went from an implied 71.4% for San Francisco at open to 79.8% now. The AP preview published on October 15 already listed the 49ers by 7.5, so most or all of that move had happened by midweek. ESPN's Matchup Predictor gives San Francisco an 87.0% chance to win, higher than the moneyline implies.

The total has moved the same direction, from 50.5 at open to 51.5, with the over now priced at -115. For context, the five San Francisco games have averaged 49.4 combined points (34, 48, 66, 38 and 61), and two of them went over 51.5. Washington's games have averaged 52.8 (46, 57, 64, 43 and 54), with three of five over this number. Against the spread, the AP lists San Francisco at 4 and 1 and Washington at 2 and 3. Weather in Santa Clara is forecast at 65 degrees with gusts to 16 mph, per ESPN.

What the market is saying is simple: it believes the 49ers' close wins over Arizona and Seattle were the outliers and the three comfortable wins were the truth, and it does not trust a Washington defense that has bled points late in games. The case against that view is just as simple. Washington protects the ball, controls the clock, and now has its quarterback back. Whether those two things are enough to keep a game inside 7.5 against an offense this efficient is the question every bettor has to answer for themselves. BetLegend's Featured Game is analysis only; we post no pick here.

Final Thoughts

San Francisco is the better team by every efficiency measure on this page: more yards per play, far better passing efficiency, a dominant third down offense, the best red zone touchdown rate in the league per the AP, and a pass protection unit that has allowed three sacks in five games. Washington's defense ranks near the bottom in the areas that matter most against this offense, especially in the red zone and after halftime.

But this is not the same Washington team that lost to Indianapolis in London. Daniels is back, the Commanders rarely turn it over, and their rushing game with a mobile quarterback is a genuine stress test for a 49ers defense that has not yet faced one like it. Watch the first two Washington drives. If Daniels is extending plays and the Commanders are converting on third down, this game looks a lot more like San Francisco's wins over Arizona and Seattle than its wins over the Rams and Dolphins. If the 49ers are forcing third and long and Purdy is finishing drives in the end zone, the 7.5 will look like it was set for a reason. Check Evans and Diggs at the inactive list, and check the final number before kickoff.

Where Every Number Came From

Every number in this breakdown was read live on October 19, 2026 between 9:00 and 9:30 AM Pacific. Odds, open and current: ESPN game summary pickcenter, DraftKings. Records, standings, points for and against, last five results, team leaders, injuries, broadcast, venue, weather and the Matchup Predictor: ESPN game summary for event 401873008. Team passing, rushing, third down, red zone, turnover and sack numbers: ESPN's 2026 regular season team statistics for both clubs. Per game quarterback lines: ESPN box scores of each team's five games. Against the spread records, the all time series, the last meeting, quarterback rushing yards allowed, second half points allowed, red zone ranks, Purdy's career passer rating and Pineiro's misses: the Associated Press preview published on ESPN. EPA per play and success rate were not available from these sources and are not used.

Frequently Asked Questions

What time is Commanders vs 49ers on October 19, 2026?
Monday, October 19, 2026 at 5:15 PM Pacific (8:15 PM Eastern) at Levi's Stadium in Santa Clara, California, on ESPN and ABC.
What are the betting odds for Commanders vs 49ers?
At DraftKings via ESPN, read 9:04 AM Pacific on October 19: 49ers -7.5 at -108 and Commanders +7.5 at -112 on the spread, 49ers -395 and Commanders +310 on the moneyline, and a total of 51.5 with the over -115 and the under -105. The line opened 49ers -5.5, 49ers -250 and Commanders +205, with a total of 50.5.
What are the records of the Commanders and 49ers?
San Francisco is 5 and 0, 3 and 0 at home, first in the NFC West. Washington is 1 and 3 with one tie, 0 and 2 on the road, fourth in the NFC East. The 49ers have scored 154 points and allowed 93; the Commanders have scored 115 and allowed 149.
Where is the game played?
Levi's Stadium in Santa Clara, California, home of the 49ers. Per the Associated Press preview on ESPN, Washington is one of seven teams that have never won at Levi's Stadium since it opened in 2014.
Who are the key players to watch?
For San Francisco, Brock Purdy (1,196 passing yards, 13 touchdowns, 2 interceptions), Christian McCaffrey (286 rushing yards, 5 touchdowns), Mike Evans (326 receiving yards, questionable with a rib injury) and Fred Warner (50 tackles). For Washington, Jayden Daniels (459 passing yards and 203 rushing yards in three games), Jacory Croskey-Merritt (239 rushing yards), Terry McLaurin (203 receiving yards) and K'Lavon Chaisson (2.5 sacks).
Who is injured for Commanders vs 49ers?
Per the ESPN injury report: for San Francisco, Christian Kirk is on injured reserve, Marques Sigle is out, and Mike Evans, Mykel Williams and Upton Stout are questionable. For Washington, Trey Amos and Jeremy McNichols are on injured reserve, Javontae Jean-Baptiste and Charles Omenihu are out, and Stefon Diggs is questionable with a hamstring injury.

Link to this breakdown

MLB | Sunday, October 18

Rays vs Guardians ALCS Game 5: The Series Is Tied 2 To 2, And The Game 1 And Game 2 Starters Meet Again With A Pennant Lead On The Line

Tampa Bay Rays at Cleveland Guardians, American League Championship Series Game 5, Featured Game of the Day

Four games in, Tampa Bay has scored 15 runs and Cleveland has scored 14. The Guardians stole Game 1 in St. Petersburg, the Rays answered behind Freddy Peralta, Cleveland held on 3 to 2 in Game 3, and after Friday's rainout Tampa Bay won Game 4 by a 7 to 3 score on Saturday. Now it is a best of three, and Game 5 at Progressive Field starts at 2:08 PM Pacific with Drew Rasmussen, who has a 1.29 ERA this October, against Parker Messick, who has allowed just 2 earned runs to the Rays in 18.1 innings this year. DraftKings has the Rays at -132.

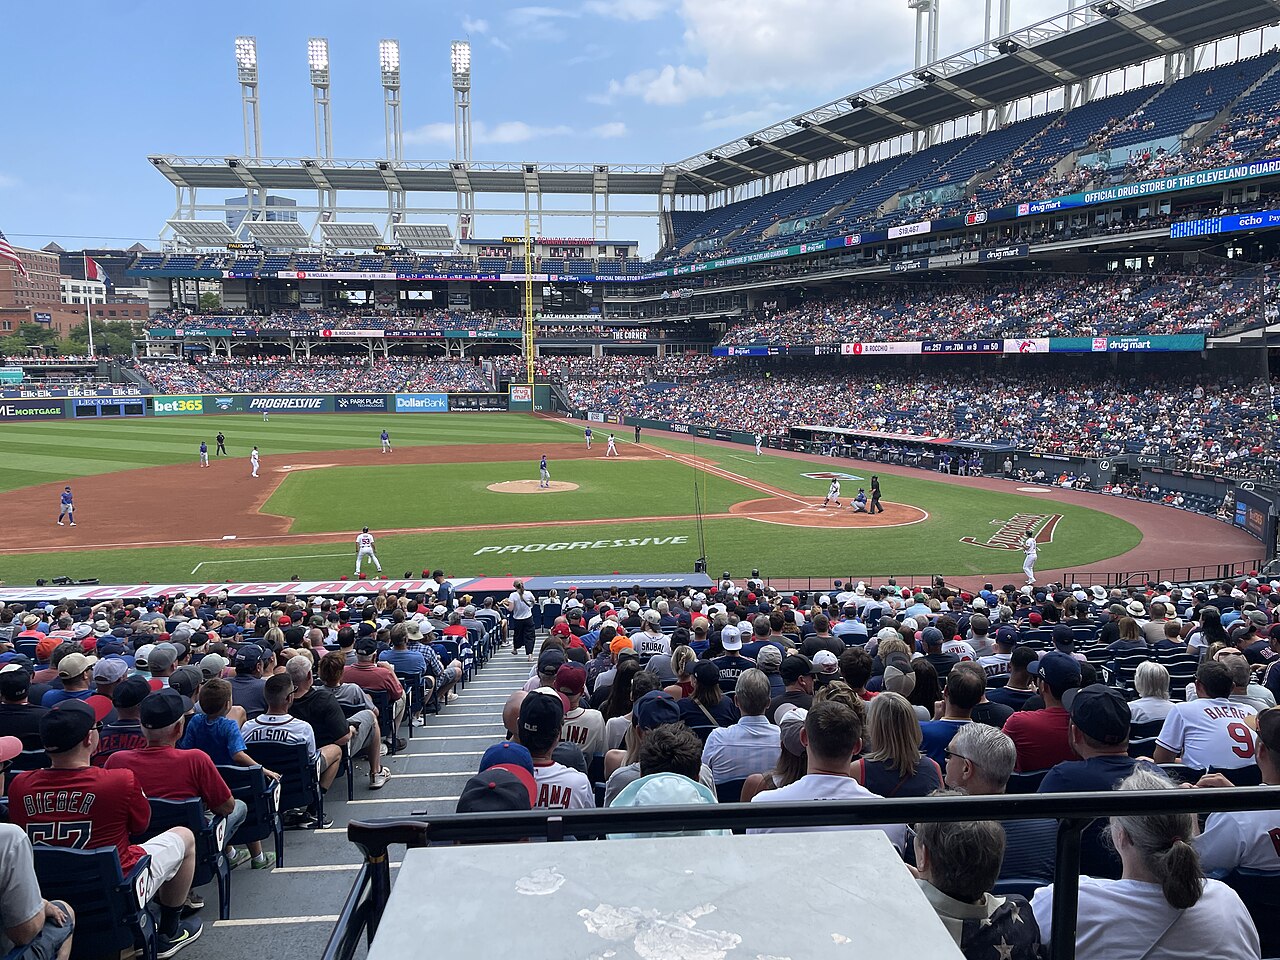
A Cleveland Guardians home game in progress at Progressive Field in August 2026, seen from the lower bowl behind first base with a packed crowd
Progressive Field during the Guardians game against the Mets on August 6, 2026. Game 5 of the ALCS is played here on Sunday afternoon | Photo: Deans Charbal, CC BY-SA 4.0, via Wikimedia Commons

Tampa Bay Rays Rays vs Guardians Cleveland Guardians

Sunday, October 18, 2026 | 2:08 PM PT / 5:08 PM ET | Progressive Field, Cleveland, OH | TBS, HBO Max, truTV
ALCS Game 5 | Series tied 2, 2 | Rays 98, 64 | Guardians 85, 77 | Rays won the season series 5, 1
Moneyline
TB -132 / CLE +110
Run Line
TB -1.5 (+135) / CLE +1.5 (-164)
Total
6.5 (o -102 / u -118)
Implied Probability
TB 56.9% / CLE 47.6%
Lines: DraftKings via ESPN, read 10:12 AM PT October 18. Opened TB -128 / CLE +107, run line TB -1.5 at +153, total 6.5 (o -120 / u +100).

Matchup Context

This series has been as even as a series can be. Through four games Tampa Bay has scored 15 runs and Cleveland has scored 14, and two of the four games were decided by two runs or fewer. The regular season said it should not look like this. The Rays went 98 and 64, including 43 and 38 on the road, and won the season series 5 games to 1. Cleveland went 85 and 77 and was only 41 and 40 at Progressive Field. In October, none of that has mattered much.

Game 1 went to Cleveland 7 to 3 at Tropicana Field. Rasmussen gave Tampa Bay 6 innings of two run ball, and then the Rays bullpen allowed five earned runs as the Guardians finished with 14 hits. Game 2 flipped it. Peralta threw 6 scoreless innings, Tampa Bay scored three unearned runs off Messick in the fourth inning, Liam Hicks drove in two of them, and Bryan Baker closed a 3 to 1 win.

The series moved to Cleveland on Thursday and stayed tight. Gavin Williams struck out 9 in 5 innings, Petey Halpin homered and drove in two, and Cade Smith got the last four outs of a 3 to 2 Guardians win against a Rays staff that opened with Griffin Jax. Friday's Game 4 was rained out, and on Saturday the Rays took the makeup 7 to 3. Nick Martinez allowed one run in 5.1 innings, Yandy Diaz homered and drove in two, Jonathan Aranda had three hits and two RBI, and Tampa Bay broke it open with three runs in the seventh and two in the ninth against a Cleveland bullpen game that started with Shawn Armstrong.

That rainout is why today's matchup looks the way it does. Game 5 brings back both Game 1 and Game 2 starters, with Rasmussen pitching on five days of rest and Messick on four, and it is a day game in Cleveland with Games 6 and 7, if needed, still ahead.

Injury Report & Lineup Notes

Tampa Bay Rays
McClanahan (SP) OUT
Shane McClanahan, forearm soreness, listed out by ESPN in an update dated October 11.
Lux, Melton OUT
Gavin Lux (shoulder inflammation) and Jacob Melton (hamstring strain), both on the 60 day injured list.
Uceta, Heasley (RP) OUT
Edwin Uceta (shoulder strain) and Jonathan Heasley (elbow fracture), 60 day injured list.
Starting
Drew Rasmussen (RHP), listed as the probable by MLB and ESPN. Last pitched October 12 in Game 1.
Cleveland Guardians
Hoskins (1B) OUT
Rhys Hoskins, back inflammation, 10 day injured list per ESPN.
Holderman, Walters (RP) OUT
Colin Holderman (wrist surgery, 15 day list, ESPN update dated October 14) and Andrew Walters (elbow surgery), both out.
Starting
Parker Messick (LHP), listed as the probable by MLB and ESPN. Last pitched October 13 in Game 2.

The bigger note is the bullpen. Cleveland used seven pitchers on Saturday, including Daniel Espino, Tim Herrin, Slade Cecconi, Matt Festa and Joey Cantillo, but did not use Cade Smith or Hunter Gaddis. Tampa Bay used six, including Ian Seymour for 29 pitches and Baker for an inning, and also got two thirds of an inning from Peralta in relief. Both managers will want length from the starter today.

Rasmussen vs Messick

Drew Rasmussen

Rasmussen brings the stronger regular season line of the two starters: 16 and 5 with a 2.67 ERA and a 0.91 WHIP in 30 starts, 174 strikeouts against 32 walks in 172 innings, and a .199 batting average against. His FIP, calculated from MLB's 2026 league totals, is 2.81, so the ERA is backed by the peripherals. He was even better on the road, a 2.47 ERA and 0.81 WHIP in 87.1 innings, and he handled both sides of the plate, a .568 OPS against left handed hitters and .510 against right handers.

His October has been just as strong. He threw 8 innings of one hit, scoreless ball with 10 strikeouts against the Yankees in the division series opener, then gave Cleveland 6 innings, 2 earned runs, 7 strikeouts and no walks in Game 1 of this series. The two runs came on solo shots, and that is the one crack: 8 hits and 2 home runs allowed in that start, after the Guardians hit .239 as a team all year. He faced Cleveland twice in the regular season, 5 innings and 2 earned runs on April 29 and 7 scoreless innings with 9 strikeouts on July 26.

Parker Messick

Messick, Cleveland's All Star left hander, finished the regular season 12 and 9 with a 2.56 ERA, a 1.06 WHIP and 193 strikeouts in 186.1 innings. His FIP works out to 3.06, still excellent. He was a little worse at home (2.90 ERA, 1.15 WHIP) than on the road, and right handed hitters had a .599 OPS against him to .688 for left handers.

He has been very good against this lineup in particular. Messick held Tampa Bay to one earned run in 5.2 innings on April 27 and one in 7.2 innings on July 26, and in Game 2 he allowed no earned runs in 5 innings. That is 2 earned runs in 18.1 innings against the Rays this year. Even so, he took the loss in Game 2: Tampa Bay scored all three of its runs in the fourth inning, all of them unearned, and Cleveland was charged with an error.

The concern is his control this month. Across three postseason starts he has a 3.09 ERA but a 1.71 WHIP, with 8 walks and 14 strikeouts in 11.2 innings. He has not completed six innings since September 16, and his last regular season start lasted three. Against a Rays lineup that puts the ball in play, those walks are what turn a quiet inning into a crooked number.

Advanced Stats & Style Profile

Tampa Bay Rays (2026)

Record98, 64
Runs scored / allowed736 / 650
AVG / OBP / SLG.258 / .326 / .402
Team wRC+ (FanGraphs)104
Home runs / steals / walks169 / 164 / 514
Batting strikeouts1,145
Team ERA / WHIP3.70 / 1.14
Rasmussen ERA / FIP / WHIP2.67 / 2.81 / 0.91

Cleveland Guardians (2026)

Record85, 77
Runs scored / allowed678 / 667
AVG / OBP / SLG.239 / .316 / .380
Team wRC+ (FanGraphs)97
Home runs / steals / walks162 / 146 / 574
Batting strikeouts1,271
Team ERA / WHIP3.77 / 1.26
Messick ERA / FIP / WHIP2.56 / 3.06 / 1.06

FanGraphs has Tampa Bay at a 104 wRC+ and Cleveland at 97, where 100 is league average, so the Rays carry the better offense by about seven points after park and league adjustments. The profiles are close in shape: both teams run (164 and 146 steals), neither hits for much power (169 and 162 homers), and the Rays make more contact while the Guardians walk more, 574 times to 514.

Caminero is still the bat that matters most for Tampa Bay, 42 home runs, 101 RBI and an .884 OPS in the regular season. Diaz (.805 OPS) and Aranda (.792) were the Game 4 heroes. For Cleveland, Chase DeLauter (.287, .820 OPS) homered in Game 1, Steven Kwan got on base at a .382 clip all year, and Jose Ramirez, a .688 OPS hitter with 37 steals in the regular season, is 5 for 8 in Games 1 and 3. Travis Bazzana (.743 OPS, 19 steals) homered on Saturday.

On the pitching side the season ERAs are nearly identical, 3.70 for Tampa Bay and 3.77 for Cleveland, but they get there differently. Cleveland's staff struck out 1,530 hitters, 208 more than the Rays, and walked 530. Tampa Bay allowed a 1.14 WHIP but 201 home runs. With a total of 6.5, the market expects both starters to control this game.

Keys To The Game

Rays Keys
Keep the ball in the park. Rasmussen allowed 14 homers in 172 regular season innings, then 2 to Cleveland in Game 1. Solo shots are the only way the Guardians have scored off him in October.
Make Messick throw strikes. Eight walks in 11.2 postseason innings. A patient first two innings can push him out early and into a Cleveland bullpen that worked hard on Saturday.
Ride the hot bats. Diaz, Aranda and Richie Palacios combined for 8 hits in Game 4.
Guardians Keys
Messick gets through five. He has allowed 2 earned runs in 18.1 innings to Tampa Bay this year. Length is the problem, not results.
Clean defense. All three runs in Game 2 were unearned. In a game priced at 6.5, one extra out can decide it.
Hand a lead to Smith. Cade Smith and Gaddis both stayed down on Saturday, so Cleveland's best late arms should be available.

Market Context

DraftKings, as shown in ESPN's odds feed at 10:12 AM Pacific, has Tampa Bay -132 and Cleveland +110. The Rays opened -128, so the money has nudged toward the road team by four cents since the open, a small move that fits Saturday's result and the Rasmussen matchup. At -132 the Rays are implied at 56.9 percent before the vig comes out. ESPN's matchup predictor leans the other way, giving Cleveland a 56.3 percent chance to win at home, so the model and the market disagree on the favorite.

The run line has moved more than the moneyline. Rays -1.5 opened at +153 and is now +135, with Cleveland +1.5 going from -186 to -164. The total has held at 6.5, but the juice has flipped: the over opened -120 and is now -102, while the under went from +100 to -118. So the number did not move, but the price now leans toward a low scoring game. Lines can shift again once lineups post, so check them before first pitch.

Final Thoughts

The case for Tampa Bay is Rasmussen. He has the best numbers of anyone pitching today, 2.67 ERA and 2.81 FIP in the regular season and 1.29 in October, he has held this lineup to 4 earned runs in 18 innings across three starts this year, and the Rays carry the better offense by wRC+. The case for Cleveland is Messick against this specific lineup, 2 earned runs in 18.1 innings, plus home field and a rested late inning group.

The cleanest way to read it: if Messick throws strikes, this looks like a game decided in the seventh inning or later, which is where Cleveland's bullpen depth matters. If his October walk problem shows up early, Tampa Bay has the speed and contact to turn it into runs, and Rasmussen has not needed many. The winner goes to Game 6 needing one more.

This page is analysis only and carries no pick. Every BetLegend play is posted separately before the game and graded when it goes final at trustmyrecord.com.

Where Every Number Came From

Verification note (October 18, 2026, read between 10:12 and 10:35 AM PT). First pitch time, the probable starters, broadcast, the series status and the postponement come from MLB's schedule feed for game 849817; ESPN lists the same game as event 401930515. Records, home and road records, the season series, ESPN's injury list and the matchup predictor come from ESPN's MLB game summary for event 401930515. The DraftKings open and current moneyline, run line and total come from ESPN's odds feed for the same event, read at 10:12 AM PT. Results, pitching lines, hitting lines and inning by inning scoring for Games 1 through 4 come from MLB's box scores and line scores for games 849820, 849813, 849818 and 849816. Rasmussen's and Messick's season lines, home and road and platoon splits, game logs and postseason logs come from MLB's pitcher stats feeds. Team batting and pitching totals come from MLB's 2026 regular season team stats; player batting lines from MLB's active roster stats. FIP is calculated as (13 x HR + 3 x (BB + HBP), less 2 x K) divided by innings, plus a league constant of 3.09 derived from MLB's 2026 league pitching totals. Team wRC+ (104 for Tampa Bay, 97 for Cleveland) comes from FanGraphs' 2026 team batting pages for both clubs, read at about 10:20 AM PT; the plate appearances, home runs, steals, on base and slugging on those pages match MLB's regular season team totals exactly.

Frequently Asked Questions

What time is Rays vs Guardians ALCS Game 5 on October 18, 2026?
Sunday, October 18, 2026 at 2:08 PM Pacific (5:08 PM Eastern) at Progressive Field in Cleveland, Ohio, on TBS, HBO Max and truTV. The game was originally scheduled as Game 4 on October 16 and was postponed by rain.
What are the betting odds for Rays vs Guardians Game 5?
At DraftKings via ESPN, read 10:12 AM Pacific on October 18: Rays -132 and Guardians +110 on the moneyline, Rays -1.5 at +135 and Guardians +1.5 at -164 on the run line, and a total of 6.5 with the over -102 and the under -118. The Rays opened -128 and the total opened at 6.5 with the over -120.
What is the ALCS series score between the Rays and Guardians?
The series is tied 2 games to 2. Cleveland won Game 1 7 to 3 and Game 3 3 to 2. Tampa Bay won Game 2 3 to 1 and Game 4 7 to 3. The winner of Game 5 goes up 3 games to 2.
Who are the starting pitchers for Rays vs Guardians Game 5?
Drew Rasmussen for Tampa Bay (16 and 5, 2.67 ERA, 0.91 WHIP in the regular season; 1.29 ERA in two postseason starts) and Parker Messick for Cleveland (12 and 9, 2.56 ERA, 1.06 WHIP in the regular season; 3.09 ERA and 1.71 WHIP in three postseason starts).
Who are the key players to watch?
For Tampa Bay, Junior Caminero (42 home runs, .884 OPS), Yandy Diaz (home run and 2 RBI in Game 4) and Jonathan Aranda (3 for 4 in Game 4). For Cleveland, Chase DeLauter (.820 OPS, a Game 1 home run), Jose Ramirez (5 for 8 in Games 1 and 3) and Steven Kwan (.382 on base percentage).
How did the Rays and Guardians do against each other in the 2026 regular season?
Tampa Bay won the regular season series 5 games to 1, according to ESPN.

Link to this breakdown

NCAAF | Saturday, October 17

Unbeaten No. 11 Utah Visits Colorado, Where The Buffaloes Need Answers After Three Straight Losses

Utah Utes at Colorado Buffaloes, NCAAF Regular Season, Big 12, Folsom Field, Featured Game of the Day

Utah is 5 and 0, ranked No. 11, and has scored 42.8 points a game while allowing 13.0. Colorado opened 2 and 0 and has dropped three straight, scoring 27 points total across those losses. The Buffaloes are home and coming off an open week, and DraftKings has Utah -15.5, down from an open of -16.5, with the total at 49.5. Kickoff is 7:15 PM Pacific on ESPN.

Colorado Buffaloes players in white road uniforms and white helmets walking on the field during a Big 12 night game against Houston
Colorado Buffaloes players on the field during a Big 12 road game against Houston last season. The Buffaloes host unbeaten Utah at Folsom Field | Photo: 2C2K Photography, CC BY 4.0, via Wikimedia Commons

Utah Utes Utah vs Colorado Colorado Buffaloes

Saturday, October 17, 2026 | 7:15 PM PT / 10:15 PM ET | Folsom Field, Boulder, CO | ESPN
Big 12 | No. 11 Utah (5-0), 2 and 0 Big 12 | Colorado (2-3), 0 and 2 Big 12
Moneyline
UTAH -800 / COLO +550
Spread
UTAH -15.5 (-112) / COLO +15.5 (-108)
Total
49.5 (o -110 / u -110)
Implied Probability
UTAH 88.9% / COLO 15.4%
Lines: DraftKings via ESPN, read 5:24 PM PT October 17. Opened UTAH -16.5 (-118) / COLO +16.5 (-102), moneyline UTAH -750 / COLO +525, total 49.5 (o -110 / u -110).

Matchup Context

Utah hasn't been tested much yet. The Utes are 5 and 0, 2 and 0 in the Big 12, and No. 11 in both the AP Top 25 and the Coaches Poll. They've scored 214 points in five games and allowed 65. The results tell the story: 66 to 14 over Idaho, 43 to 10 over Arkansas, a 33 to 0 shutout of Utah State, 31 to 17 at Iowa State and 41 to 24 over Kansas last weekend. Only Iowa State and Kansas kept it within three scores, and only one opponent, Kansas, got past 17.

Colorado started 2 and 0 and has been going backward since. The Buffaloes opened by edging Georgia Tech 14 to 13 on the road and then beat Weber State 52 to 21 at home. Then came three straight losses: 41 to 7 at Northwestern, 23 to 13 at Baylor and 29 to 7 at home against Texas Tech on October 3. That's 27 points in three games. Colorado is 2 and 3 overall and 0 and 2 in the conference, and it didn't play last weekend, so it comes in with an extra week since the Texas Tech loss.

So this game has a pretty clear frame. Utah is trying to stay unbeaten and in the top tier of the Big 12 race on the road at night. Colorado is home, rested, and badly needs a result to keep its conference season from slipping away before Halloween. The market has Utah favored by more than two touchdowns and priced as a heavy moneyline favorite. The interesting question is whether a Colorado offense that hasn't topped 13 points since mid September can do enough to stay inside that number.

Injury Report & Lineup Notes

Utah Utes
Injury report
None are listed in ESPN's game summary as of 5:24 PM PT.
Quarterback
Devon Dampier, Utah's passing leader: 94 of 131, 1,134 yards, 12 touchdowns, 2 interceptions.
Colorado Buffaloes
Injury report
None are listed in ESPN's game summary as of 5:24 PM PT.
Quarterback
Julian Lewis, Colorado's passing leader: 61 of 95, 733 yards, 6 touchdowns, 2 interceptions.

ESPN's summary for this game had no injury entries for either side when we read it. "None listed" means just that: nothing had been posted to ESPN's feed for this game at read time, so check again closer to kickoff. One thing worth knowing on Colorado's side is that the team has thrown 6 interceptions this season and Lewis is charged with 2 of them, so the box score doesn't fit a single passer carrying the whole load. Watch who's taking snaps early.

Dampier's Offense vs Colorado's Defense

Utah with the ball

Utah's offense is balanced and very efficient. The Utes average 502.0 yards per game, 264.0 through the air and 238.0 on the ground. They gain 6.0 yards per carry and 8.9 yards per pass attempt, and they've converted 54.1 percent of their third downs. That's an offense that rarely ends up in third and long, and when it does, it keeps moving anyway.

Dampier is the engine. He's completed 94 of 131 passes for 1,134 yards with 12 touchdowns and only 2 interceptions, and the team has thrown just those 2 picks all year. Wayshawn Parker has 499 rushing yards and 7 touchdowns on only 66 carries, which works out to about 7.6 yards a carry. Braden Pegan leads the receivers with 24 catches for 336 yards and 4 scores. Utah's line has given up only 6 sacks in five games.

Colorado's defense is allowing 346.8 yards and 25.4 points per game, with 216.6 yards a game against the pass and 130.2 on the ground. The Buffaloes do get home: they have 10 sacks as a team, and Lamont Lester Jr. has 4 of them. Defensive back Randon Fontenette leads the team with 39 tackles. For Colorado, the plan pretty much has to be pressure. A defense that gives up 130 rushing yards a game isn't going to keep Parker and Utah's ground game in check on its own, so Lester and the front have to create negative plays and turn drives into third and long.

Colorado with the ball

This is where the matchup gets lopsided on paper. Colorado averages 18.6 points and 394.2 yards per game, with 253.4 passing and 140.8 rushing. The yards aren't the problem; finishing is. The Buffaloes average 3.7 yards per carry and 7.0 per pass attempt, complete 61.3 percent of their throws and convert only 35.6 percent on third down. They've also allowed 11 sacks.

Lewis has the best season line of anyone on the roster: 733 yards, 6 touchdowns and 2 interceptions on 61 of 95 passing. Joseph Williams is the go to receiver with 32 catches for 454 yards and 5 touchdowns. Micah Welch leads the ground game with 218 yards and 2 touchdowns on 44 carries. That's the core of a unit that's trying to do it against a Utah defense allowing 13.0 points and 285.0 yards per game, only 78.8 of them on the ground, with 11 sacks. Trey Reynolds leads Utah with 32 tackles and Karson Kaufusi leads the pass rush with 2 sacks. If Colorado can't run, it's in third and long against a defense that's been getting home, and that's how 7 point nights happen.

Advanced Stats & Style Profile

Utah Utes (2026)

Record5 and 0 (2 and 0 Big 12)
Points per game / allowed42.8 / 13.0
Yards per game / allowed502.0 / 285.0
Pass yards per game / allowed264.0 / 206.2
Rush yards per game / allowed238.0 / 78.8
Yards per carry / per pass attempt6.0 / 8.9
Completion percentage69.8%
Third down conversion54.1%
Sacks made / allowed11 / 6

Colorado Buffaloes (2026)

Record2 and 3 (0 and 2 Big 12)
Points per game / allowed18.6 / 25.4
Yards per game / allowed394.2 / 346.8
Pass yards per game / allowed253.4 / 216.6
Rush yards per game / allowed140.8 / 130.2
Yards per carry / per pass attempt3.7 / 7.0
Completion percentage61.3%
Third down conversion35.6%
Sacks made / allowed10 / 11

Line these up and the gap is wide in almost every column. Utah outgains its opponents by 217 yards a game; Colorado outgains its opponents by about 47, but gets outscored by almost 7 points a game. That's the profile of a team that moves the ball between the 20s and doesn't cash it in, and the third down rate backs that up. Utah converts more than half its third downs; Colorado converts barely one in three.

The biggest single gap is in the run game. Utah runs for 238.0 yards a game at 6.0 a carry and allows 78.8. Colorado runs for 140.8 at 3.7 a carry and allows 130.2. If that holds tonight, Utah controls the clock and the field position, and Colorado has to win through the air on obvious passing downs. The one category where Colorado looks competitive is the pass rush, 10 sacks to Utah's 11, and that's the lever it'll need.

Recent form says the same thing. Utah's last five are all wins by 14 points or more. Colorado's last five include three losses by 10 or more, and its only win other than Weber State was a one point game at Georgia Tech in the opener.

Keys To The Game

Utah Keys
Stay on schedule. A 54.1 percent third down rate and only 6 sacks allowed mean Utah rarely gets behind the chains. Lester and his 4 sacks are the main threat to that.
Lean on Parker. 7 touchdowns on 66 carries, against a defense allowing 130.2 rushing yards a game.
Protect the ball. Dampier has 2 interceptions all year. Short fields are the easiest way for an offense averaging 18.6 points to get back in it.
Colorado Keys
Win on third down. 35.6 percent won't cut it against a defense allowing 13.0 points a game. Staying ahead of the chains starts with getting Welch going early.
Get Williams the ball. 454 yards and 5 touchdowns. He's the one Colorado player with big play numbers against a defense allowing 206.2 passing yards.
Use the rest. Colorado had last weekend off; Utah played Kansas. The Buffaloes need a fast start at home before Utah's run game settles in.

Market Context

DraftKings, as shown in ESPN's odds feed at 5:24 PM Pacific, has Utah -15.5 at -112 and Colorado +15.5 at -108. The spread opened at Utah -16.5 (-118), so the number has come down a full point toward Colorado. The moneyline has gone the other way: Utah opened -750 and is now -800, with Colorado moving from +525 to +550. At -800 Utah's implied win probability is 88.9 percent before the vig, and ESPN's matchup predictor is almost exactly there at 87.7 percent.

The total opened at 49.5 and hasn't moved, still -110 on both sides. For reference, three of Utah's five games have gone over 49.5 combined points (80, 53 and 65), while only one of Colorado's five has (the 73 point win over Weber State). Colorado's three losses produced 48, 36 and 36 combined points. Lines can still move before kickoff, so check them again close to 7:15.

Final Thoughts

The case for Utah is simple: it's better at almost everything on the stat sheet. It scores 24 more points a game, allows 12 fewer, runs the ball at 6.0 yards a carry against a defense giving up 130 a game, and has thrown only 2 interceptions all season. Every one of its wins has come by 14 points or more, and Colorado's offense has scored 7 points in two of its last three games.

The case for Colorado is more about the setting than the numbers. It's at home, at night, coming off an open week, against a road team that just played. Folsom Field is where it put up 52 against Weber State, and it has a quarterback in Lewis with 6 touchdowns to 2 interceptions and a receiver in Williams with 5 touchdowns. If Lester and the pass rush can get to Dampier a few times and Colorado avoids the third and long trap, a two touchdown spread is a lot of points. The way the spread drifted down from 16.5 tells you at least some of the market sees it that way.

This page is analysis only and carries no pick. Every BetLegend play is posted separately before the game and graded when it goes final at trustmyrecord.com.

Where Every Number Came From

Verification note (October 17, 2026, read between 5:23 and 5:30 PM PT). Kickoff time, venue, ESPN broadcast, records, conference records, the injury list (none listed), season leaders, the last five results for each team and the matchup predictor come from ESPN's college football game summary for event 401856833, with the game confirmed as scheduled (not yet started) on ESPN's scoreboard. The DraftKings current and opening spread, moneyline and total come from ESPN's odds feed for the same event, read at 5:24 PM PT. Rankings come from ESPN's college football rankings feed (AP Top 25 and AFCA Coaches Poll). Team scoring, yardage, per play, completion, third down and sack numbers come from ESPN's team statistics pages for Utah (team 254) and Colorado (team 38). Implied probabilities are calculated from the moneylines; yards per carry for Parker, combined game totals and margins are calculated from the ESPN figures above.

Frequently Asked Questions

What time is Utah vs Colorado on October 17, 2026?
Saturday, October 17, 2026 at 7:15 PM Pacific (10:15 PM Eastern) at Folsom Field in Boulder, Colorado, on ESPN.
What are the betting odds for Utah vs Colorado?
At DraftKings via ESPN, read 5:24 PM Pacific on October 17: Utah -15.5 (-112) and Colorado +15.5 (-108) on the spread, Utah -800 and Colorado +550 on the moneyline, and a total of 49.5 with both sides at -110. Utah opened -16.5 and -750; the total opened at 49.5.
What are Utah's and Colorado's records?
Utah is 5 and 0 overall and 2 and 0 in Big 12 play, ranked No. 11 in both the AP Top 25 and the AFCA Coaches Poll. Colorado is 2 and 3 overall and 0 and 2 in the Big 12, and has lost three straight.
Where is the game played?
Folsom Field in Boulder, Colorado, a natural grass stadium and Colorado's home field.
Who are the key players to watch?
For Utah, quarterback Devon Dampier (94 of 131, 1,134 yards, 12 touchdowns, 2 interceptions), running back Wayshawn Parker (66 carries, 499 yards, 7 touchdowns) and receiver Braden Pegan (24 catches, 336 yards, 4 touchdowns). For Colorado, quarterback Julian Lewis (61 of 95, 733 yards, 6 touchdowns, 2 interceptions), receiver Joseph Williams (32 catches, 454 yards, 5 touchdowns) and defensive lineman Lamont Lester Jr. (4 sacks).
Are there any injuries listed for Utah vs Colorado?
ESPN's game summary listed no injuries for either team when it was read at 5:24 PM Pacific on October 17.

Link to this breakdown

MLB | Wednesday, October 14

Brewers vs Dodgers NLCS Game 3: Milwaukee Won Both Games At Home, And Now Blake Snell Gets The Ball At Dodger Stadium

Milwaukee Brewers at Los Angeles Dodgers, National League Championship Series Game 3, Featured Game of the Day

The Brewers held serve in Milwaukee. They beat Tarik Skubal 2 to 1 in Game 1, then knocked Yoshinobu Yamamoto out in the third inning of Game 2 and won 7 to 4. Now the series moves to Los Angeles for three straight, and the Dodgers hand the ball to Blake Snell, who has a 1.90 ERA and has not allowed a home run in nine starts since coming off the injured list. Milwaukee counters with Robert Gasser and his 3.87 ERA. DraftKings has the Dodgers at -181, up from an open of -166.

Los Angeles Dodgers star Shohei Ohtani in the Dodgers white uniform and blue batting helmet, holding his bat before an at bat
Shohei Ohtani at the 2025 Tokyo Series. His .889 OPS led the Dodgers this season, and Los Angeles has scored five runs in two NLCS games | Photo: ウィ貴公子, CC BY-SA 4.0, via Wikimedia Commons

Milwaukee Brewers Brewers vs Dodgers Los Angeles Dodgers

Wednesday, October 14, 2026 | 5:00 PM PT / 8:00 PM ET | Dodger Stadium, Los Angeles, CA | FS1
NLCS Game 3 | Brewers lead 2, 0 | Brewers 103, 59 (NL Central champions) | Dodgers 100, 62 (NL West champions) | Brewers won the season series 4, 3
Moneyline
MIL +149 / LAD -181
Run Line
MIL +1.5 (-150) / LAD -1.5 (+124)
Total
7.5 (o -106 / u -114)
Implied Probability
LAD 64.4% / MIL 40.2%
Lines: DraftKings via ESPN, read 5:20 AM PT October 14. Opened LAD -166 / MIL +137, run line LAD -1.5 at +137, total 7.5 (o -112 / u -107).

Matchup Context

These were the two best teams in the National League this year, and the numbers barely separate them. Milwaukee won the Central at 103 and 59 with 832 runs scored, 618 allowed and a +214 run differential. Los Angeles won the West at 100 and 62, scoring 801 and allowing 600 for a +201 differential. Both went 8 and 2 over their last ten regular season games. The Brewers were the stronger home team, 55 and 26 at American Family Field, while the Dodgers were 51 and 30 at home and 49 and 32 on the road. Los Angeles was also busier in close games, 31 and 23 in one run games to Milwaukee's 27 and 20.

Both teams needed four games in the division round. The Dodgers beat Atlanta 3 games to 1, winning 5 to 3, losing 3 to 2 in the game Snell started, then winning 3 to 1 and 4 to 1 in Atlanta. Milwaukee beat San Diego 3 games to 1, with every game decided by one or two runs: 3 to 2, 4 to 3, a 4 to 3 loss, and a 3 to 1 clincher in which Gasser started.

The first two NLCS games went to the Brewers. In Game 1 Skubal struck out seven over 5 innings, but Brice Turang homered, Jacob Misiorowski held the Dodgers to one run over 4.1 innings, and four relievers finished it, with Trevor Megill saving a 2 to 1 win. Milwaukee pitchers struck out 13. In Game 2 the Brewers chased Yamamoto after 2.2 innings and three earned runs. William Contreras went 3 for 4 with a home run and 3 RBI, Christian Yelich drove in two, and Milwaukee finished with 12 hits to the Dodgers' three in a 7 to 4 win. Across the two games the Dodgers have 10 hits and 5 runs.

The regular season was close as well. Milwaukee won the series 4 games to 3, but Los Angeles outscored them 27 to 25. The Dodgers took two of three in Milwaukee in May, including an 11 to 3 win, and then the Brewers came to Dodger Stadium in August and won three of four, 5 to 4, 4 to 1 and 6 to 2 around a 3 to 1 Dodgers win. Gasser started that lone loss on August 14. Games 4 and 5 are also in Los Angeles, Thursday and Friday at 6:00 PM Pacific.

Injury Report & Lineup Notes

Milwaukee Brewers
Woodruff (SP) OUT
Brandon Woodruff, shoulder, on the 60 day injured list per ESPN in an update dated October 13.
Priester (SP), Anderson (RP) OUT
Quinn Priester (shoulder, 60 day list) and Grant Anderson (biceps, 15 day list) per ESPN.
Zerpa, Fitzpatrick (RP) OUT
Angel Zerpa and Brian Fitzpatrick, both elbow, 60 day injured list.
Starting
Robert Gasser (LHP), confirmed as the probable by MLB and ESPN. Last pitched October 7 in the division series clincher.
Los Angeles Dodgers
Stone (SP) OUT
Gavin Stone, shoulder, 60 day injured list per ESPN.
Klein, Cousins, Casparius (RP) OUT
Will Klein and Jake Cousins (elbow) and Ben Casparius (shoulder), all on the 60 day injured list.
Graterol (RP) OUT
Brusdar Graterol, back, 60 day injured list since June.
Starting
Blake Snell (LHP), confirmed as the probable by MLB and ESPN. Last pitched October 4 in the division series.

The Woodruff update on October 13 is the injury news of the week for Milwaukee: it keeps a veteran starter out of the rest of the postseason and pushes more innings onto a staff that has already leaned hard on its bullpen. Abner Uribe and Aaron Ashby pitched in both NLCS games, and Ashby threw 3.2 innings across the two, so a long start from Gasser matters. The Dodgers bullpen is thinner than usual too, with four relievers on the 60 day list, and it used seven relievers in Game 2. Snell comes in on long rest, ten days after his October 4 start.

Gasser vs Snell

Robert Gasser

Gasser made 20 starts this season and finished 5 and 5 with a 3.87 ERA, a 1.19 WHIP and 103 strikeouts in 109.1 innings. Using MLB's 2026 league totals his FIP works out to 4.23, so the ERA is a little better than the underlying numbers, mostly because of 15 home runs allowed and 10 hit batters. He was clearly better at home (3.40 ERA, .655 OPS against) than on the road (4.36 ERA, .746 OPS against), and tonight he is on the road.

The platoon split is the number to watch. Left handed hitters managed a .552 OPS against Gasser this year, right handers .765, and 13 of his 15 home runs allowed came against right handed bats. That matters against a Dodgers lineup whose top regular season hitter, Ohtani, bats left, but which also features Mookie Betts, Andy Pages and Teoscar Hernandez from the right side. He has been steady lately: over his final eight regular season starts he never allowed more than four earned runs, and on September 19 he threw 7 scoreless innings against Baltimore. His one October start went 4 innings with 1 earned run against San Diego. He started against the Dodgers on August 14 and allowed 3 earned runs in 6.1 innings in a 3 to 1 loss.

Blake Snell

Snell missed most of the season and came off the 60 day injured list on August 11. Since then he has made nine starts with a 1.90 ERA, a 1.10 WHIP and 55 strikeouts in 42.2 innings. Opponents hit .203 against him, and he has not allowed a single home run. His FIP over those nine starts is 1.71, even lower than the ERA, because the only blemish is 16 walks. He has been almost the same pitcher at home (2.14 ERA) and on the road (1.66 ERA).

The concerns are length and control. Snell has not completed six innings since September 4. His September 16 start lasted one inning and his September 26 start four. In his one postseason start, Game 2 against Atlanta on October 4, he struck out five but walked five in 3.2 innings, allowed one run, and the Dodgers lost 3 to 2. Left handers have a .583 OPS against him and right handers .503, so there is no platoon side for Milwaukee to stack.

On paper this is the biggest starting pitching edge either team has had in the series. Snell's run prevention since his return is elite and his home run number is zero. Gasser is a solid starter with a big platoon split, pitching away from the park where he was at his best. The question for Los Angeles is how many innings Snell gives them before the bullpen has to cover the rest.

Advanced Stats & Style Profile

Milwaukee Brewers (2026)

Record103, 59
Run differential+214
Runs scored / allowed832 / 618
AVG / OBP / SLG.258 / .341 / .403
Team wRC+ (FanGraphs)107
Home runs / steals / walks154 / 162 / 668
Team ERA / WHIP3.51 / 1.18
Pitching strikeouts1,544
Gasser ERA / FIP / WHIP3.87 / 4.23 / 1.19

Los Angeles Dodgers (2026)

Record100, 62
Run differential+201
Runs scored / allowed801 / 600
AVG / OBP / SLG.257 / .338 / .424
Team wRC+ (FanGraphs)111
Home runs / steals / walks204 / 72 / 628
Team ERA / WHIP3.55 / 1.14
Pitching strikeouts1,521
Snell ERA / FIP / WHIP1.90 / 1.71 / 1.10

The two offenses get to similar run totals in very different ways. Milwaukee scored more, 832 runs, and it got there with on base skill and speed: a .341 on base percentage, 668 walks and 162 steals, more than double the Dodgers' 72. Los Angeles hit 204 home runs to Milwaukee's 154 and slugged .424 to .403. Adjusted for park and league, FanGraphs rates the Dodgers slightly better at a 111 wRC+ against Milwaukee's 107, where 100 is league average.

Milwaukee's best regular season bats were Jake Bauers (.873 OPS, 26 home runs), Jackson Chourio (.291, 25 home runs, 23 steals), Andrew Vaughn (.306 in 331 plate appearances) and Brice Turang, who drove in 100 runs and stole 19 bases. Contreras had 94 RBI and was the best hitter in Game 2. For Los Angeles, Ohtani hit .275 with 30 home runs and an .889 OPS, Max Muncy hit 29 home runs, Andy Pages drove in 85 and Freddie Freeman hit .288. Kyle Tucker had a down year at .233. The Dodgers have just 10 hits in the first two games of the series.

The pitching staffs are nearly identical over the full season: a 3.51 ERA and 1.18 WHIP for Milwaukee, 3.55 and 1.14 for Los Angeles, with 1,544 and 1,521 strikeouts and 171 and 172 home runs allowed. The difference is in the bullpens this week. Milwaukee's relievers have allowed no earned runs in 9.2 innings in the series, while the Dodgers bullpen allowed four in Game 2 alone.

Keys To The Game

Brewers Keys
Make Snell throw strikes. He walked five Braves in 3.2 innings on October 4 and 16 hitters in nine regular season starts. A patient Milwaukee lineup that drew 668 walks can run his pitch count up early.
Gasser gets through the order twice. With Woodruff out and Uribe and Ashby used in both games, five innings from the starter keeps the bullpen fresh for Games 4 and 5.
Run when they get on. One of the fastest teams in baseball, 162 steals, against a pitcher who has to work from the stretch with traffic.
Dodgers Keys
Hit the right handed bats against Gasser. Right handers had a .765 OPS against him and 13 of his 15 home runs allowed. Betts, Pages and Hernandez are the matchup.
Snell gives them five. He has a 1.90 ERA and zero home runs allowed, but he hasn't finished six innings since September 4, and the bullpen just covered 5.1 innings in Game 2.
Wake up the lineup. Ten hits in two games from a team that hit 204 home runs. The Dodgers went 51 and 30 at home this year.

Market Context

DraftKings, as shown in ESPN's odds feed at 5:20 AM Pacific, has Los Angeles -181 and Milwaukee +149. The line opened Dodgers -166 and Brewers +137, so the move has been toward the home team despite the 0 and 2 series hole. At -181 the Dodgers are implied at 64.4 percent before the vig comes out. ESPN's matchup predictor is right there with the market, giving Los Angeles a 64.8 percent chance to win.

The run line has moved the same direction: Dodgers -1.5 opened at +137 and sits at +124. The total opened at 7.5 and is still 7.5, but the juice flipped, from over -112 to under -114, which fits a game with Snell on the mound and a Brewers bullpen that has not allowed an earned run in the series. Playoff lines can still move once lineups post, so check them again before first pitch.

Final Thoughts

The case for Los Angeles is the starter and the park. Snell has been the best version of himself since August, a 1.90 ERA and no home runs allowed, and he faces a Brewers lineup that wins with walks and speed more than power. Gasser is pitching on the road, where his ERA rose by almost a run this season, against a lineup with real right handed power. The Dodgers also outscored Milwaukee over the regular season series and went 51 and 30 at home.

The case for Milwaukee is everything that has happened since Sunday. The Brewers beat Skubal and Yamamoto, their bullpen has not allowed an earned run in the series, and they won three of four at Dodger Stadium in August. If Snell's October walk problem shows up again and he is out by the fourth inning, the Brewers get to the same thin Dodgers bullpen that gave up four runs on Monday, and a 3 to 0 series lead is a very real possibility.

This page is analysis only and carries no pick. Every BetLegend play is posted separately before the game and graded when it goes final at trustmyrecord.com.

Where Every Number Came From

Verification note (October 14, 2026, read between 4:50 and 5:25 AM PT). First pitch time, venue, FS1, the series score, ESPN's injury list and the matchup predictor come from ESPN's MLB game summary for event 401908032. The DraftKings open and current moneyline, run line and total come from ESPN's odds feed for the same event, read at 5:20 AM PT. Probable starters, the broadcast and the Games 4 and 5 times were confirmed against MLB's schedule feed (game 849811 and the NLCS schedule). Standings, run differential, last ten records, one run records and home and road splits come from MLB's 2026 regular season standings. Team batting and pitching lines come from MLB's team season stats; player batting lines from MLB's active roster stats. Gasser's and Snell's season lines, game logs, home and road and platoon splits and postseason starts come from MLB's pitcher stats feeds; Snell's activation date comes from MLB's transaction log. Games 1 and 2 details come from MLB's box scores for games 849809 and 849812, and the division series results from MLB's schedule feed. The regular season series comes from MLB's 2026 schedule for these two teams. FIP is calculated as (13 x HR + 3 x (BB + HBP), less 2 x K) divided by innings, plus a league constant of 3.09 derived from MLB's 2026 league pitching totals. Team wRC+ (107 for Milwaukee, 111 for Los Angeles) comes from FanGraphs' 2026 team batting pages for both clubs; the plate appearances, home runs, steals, on base and slugging on those pages match MLB's regular season team totals exactly.

Frequently Asked Questions

What time is Brewers vs Dodgers NLCS Game 3 on October 14, 2026?
Wednesday, October 14, 2026 at 5:00 PM Pacific (8:00 PM Eastern) at Dodger Stadium in Los Angeles, on FS1.
What are the betting odds for Brewers vs Dodgers Game 3?
At DraftKings via ESPN, read 5:20 AM Pacific on October 14: Dodgers -181 and Brewers +149 on the moneyline, Dodgers -1.5 at +124 and Brewers +1.5 at -150 on the run line, and a total of 7.5 with the over -106 and the under -114. The Dodgers opened -166.
What is the NLCS series score between the Brewers and Dodgers?
Milwaukee leads 2 games to 0 after winning Game 1 2 to 1 on October 11 and Game 2 7 to 4 on October 12, both in Milwaukee. Games 3, 4 and 5 are at Dodger Stadium, with Game 4 on Thursday, October 15 at 6:00 PM Pacific.
Who are the starting pitchers for Brewers vs Dodgers Game 3?
Robert Gasser for Milwaukee (5 and 5, 3.87 ERA, 1.19 WHIP, 103 strikeouts in 109.1 innings) and Blake Snell for Los Angeles (4 and 1, 1.90 ERA, 1.10 WHIP, 55 strikeouts in 42.2 innings over 9 starts).
Who are the key players to watch?
For Milwaukee, Jake Bauers (.873 OPS), Jackson Chourio (.838 OPS, 25 home runs), Brice Turang (100 RBI, home run in Game 1) and William Contreras (3 for 4 with a home run and 3 RBI in Game 2). For Los Angeles, Shohei Ohtani (.889 OPS, 30 home runs), Max Muncy (29 home runs), Andy Pages (85 RBI) and Freddie Freeman.
How did the Brewers and Dodgers do against each other in the 2026 regular season?
Milwaukee won the season series 4 games to 3, but the Dodgers outscored the Brewers 27 to 25. The Brewers won three of four at Dodger Stadium from August 13 through 16.

Link to this breakdown

MLB | Tuesday, October 13

Guardians vs Rays ALCS Game 2: Cleveland Stole Game 1 With A Late Rally, And Now Its Best Starter Gets The Ball In Tampa Bay

Cleveland Guardians at Tampa Bay Rays, American League Championship Series Game 2, Featured Game of the Day

Cleveland trailed 2 to 0 after one inning on Monday night and didn't score until the sixth. Then the Guardians scored seven runs over the final four innings against the Tampa Bay bullpen, won Game 1 by a 7 to 3 score, and took home field away from the team that won 98 games. Tonight they hand the ball to Parker Messick, a first time All Star with a 2.56 ERA, and the Rays answer with Freddy Peralta, who has a 1.69 ERA at Tropicana Field since Tampa Bay traded for him in August. DraftKings still has the Rays as a -136 favorite.

Tampa Bay Rays third baseman Junior Caminero in the Rays home white uniform and navy TB cap, smiling on the infield with his glove during a game
Junior Caminero on the field for the Rays in June 2026. The 42 home run third baseman is the bat Cleveland has to navigate in Game 2 | Photo: Raysfanjake1984, CC0, via Wikimedia Commons

Cleveland Guardians Guardians vs Rays Tampa Bay Rays

Tuesday, October 13, 2026 | 5:00 PM PT / 8:00 PM ET | Tropicana Field, St. Petersburg, FL | TBS, truTV
ALCS Game 2 | Guardians lead 1, 0 | Guardians 85, 77 (AL Central champions) | Rays 98, 64 (AL East champions) | Rays won the season series 5, 1
Moneyline
CLE +113 / TB -136
Run Line
CLE +1.5 (-194) / TB -1.5 (+159)
Total
7 (o -103 / u -117)
Implied Probability
TB 57.6% / CLE 46.9%
Lines: DraftKings via ESPN, read 11:14 AM PT October 13. Opened TB -134 / CLE +111, run line TB -1.5 at +163, total 7 (o -105 / u -115).

Matchup Context

On paper this series looked lopsided before it started. Tampa Bay won the American League East at 98 and 64, scored 736 runs, allowed 650 and finished with a +86 run differential. The Rays were a different team at Tropicana Field, 55 and 26 at home against 43 and 38 on the road, and they won 25 of their 39 one run games. Cleveland won the American League Central at 85 and 77 with a run differential of just +11, 678 scored and 667 allowed. Oddly, the Guardians were better away from home (44 and 37) than at Progressive Field (41 and 40). They did come in hot, 8 and 2 over their last ten regular season games, while Tampa Bay went 5 and 5.

The two division series went very differently. The Rays swept the Yankees in three straight, and all three were tight: 1 to 0 behind Drew Rasmussen, 5 to 2 in the game Peralta started, and 4 to 3 in the Bronx, with Bryan Baker saving all three. Cleveland lost the first two games of its series to the White Sox at home, 3 to 0 and 4 to 3, then won 9 to 3 and 9 to 5 in Chicago and closed it out 2 to 0 in Game 5 behind Gavin Williams and Cade Smith. The Guardians have now won four straight, three of them with their season on the line.

Game 1 on Monday followed the Cleveland script. Tampa Bay scored twice in the first inning, and Rasmussen gave the Rays 6 innings of two run ball with seven strikeouts. Cleveland chipped away with a run in the sixth and a run in the seventh, and then the Rays bullpen came apart: Tyler Wells took the loss after allowing two runs while getting one out, and Cole Sulser allowed three more in the ninth. The Guardians finished with 14 hits, and Chase DeLauter and Patrick Bailey both homered. Hunter Gaddis got the win.

The regular season says Tampa Bay owns this matchup. The Rays won the season series 5 games to 1 and outscored Cleveland 20 to 8, including a three game sweep at Tropicana Field on July 24 through 26 in which the Guardians scored three runs total. Messick started two of those six games and allowed one earned run in each one. Cleveland lost both, 3 to 2 and 1 to 0. Games 3, 4 and 5 move to Cleveland, starting Thursday at 3:00 PM Pacific.

Injury Report & Lineup Notes

Cleveland Guardians
Hoskins (1B) OUT
Rhys Hoskins, back inflammation, 10 day injured list per ESPN.
Holderman, Walters (RP) OUT
Colin Holderman (wrist surgery, 15 day list) and Andrew Walters (elbow surgery), both out per ESPN.
Starting
Parker Messick (LHP), confirmed as the probable by MLB and ESPN. Last pitched October 8 in the division series.
Tampa Bay Rays
McClanahan (SP) OUT
Shane McClanahan, forearm soreness, listed out by ESPN in an update dated October 11.
Lux, Melton OUT
Gavin Lux (shoulder inflammation) and Jacob Melton (hamstring strain), both on the 60 day injured list.
Uceta, Heasley (RP) OUT
Edwin Uceta (shoulder strain) and Jonathan Heasley (elbow fracture), 60 day injured list.
Starting
Freddy Peralta (RHP), confirmed as the probable by MLB and ESPN. Last pitched October 5 in the division series.

The injury that matters most tonight is one that isn't about tonight. McClanahan going out with forearm soreness on October 11 thins the Rays rotation for the games in Cleveland, which puts more weight on Peralta going deep. Peralta also comes in on long rest: he hasn't pitched since October 5, eight days ago. Messick is on a more normal schedule after his October 8 start in Chicago. Both bullpens worked on Monday. Cleveland used five relievers behind Foster Griffin, including Gaddis, Erik Sabrowski and closer Cade Smith, and Tampa Bay used five behind Rasmussen.

Messick vs Peralta

Parker Messick

Messick made his first All Star team this July and finished the regular season 12 and 9 with a 2.56 ERA over 32 starts and 186.1 innings. He struck out 193, walked 49 and allowed just a .217 batting average and a 1.06 WHIP. Using MLB's 2026 league totals, his FIP works out to 3.06, so there is a half run of good fortune baked into the ERA, but even the FIP is excellent. He's been better on the road than at home, a 2.22 ERA and 0.98 WHIP in 16 road starts against 2.90 at home, and he's tougher on right handed hitters (.599 OPS against) than left handed ones (.688).

Then there's his history against this lineup, which is the best case for Cleveland tonight. Messick faced Tampa Bay twice in the regular season: 5.2 innings, 1 earned run and 9 strikeouts on April 27, and 7.2 innings with 1 earned run and no walks at Tropicana Field on July 26. Both times the Guardians lost anyway.

The worry is his October so far. Messick lost Game 1 of the division series, 4.1 innings with 2 earned runs, and in his second start on October 8 he walked 4 hitters in 2.1 innings before Cleveland's offense bailed him out in a 9 to 5 win. Across the two postseason starts he has 11 strikeouts but 6 walks in 6.2 innings. His final regular season start, at Kansas City on September 27, lasted only 3 innings and 64 pitches. So the arm that dominated all summer has been short in each of his last three outings.

Freddy Peralta

Peralta's season splits in two. He made 22 starts for the Mets with a 4.99 ERA and a 1.48 WHIP, and New York traded him to Tampa Bay on August 2. In 10 starts with the Rays he has a 3.25 ERA and a 1.01 WHIP, with opponents hitting .208. At Tropicana Field the change is even bigger: 21.1 innings, a 1.69 ERA and a .416 OPS against. His full season line is 10 and 11 with a 4.42 ERA, 1.33 WHIP and 156 strikeouts in 169 innings, and his season FIP of 4.28 lines up with the ERA. Over his 10 Rays starts the FIP is 3.92, so the 3.25 ERA is somewhat better than the peripherals.

His last stretch has been steady. Over his final four regular season starts he allowed 2 earned runs in 22 innings, including 5 hitless innings against Houston on September 13. In his one postseason start, Game 2 against the Yankees, he went 4.2 innings allowing 1 earned run on a home run, with 3 strikeouts, and Tampa Bay won 5 to 2. Length is the issue: he hasn't recorded an out in the seventh inning since August 21, and the Rays have tended to take him out early. He didn't face Cleveland this season. With the Rays, left handed hitters have a .622 OPS against him and right handers .574, which matters against a Guardians lineup that leans on Kwan and Jose Ramirez near the top.

So this is Cleveland's best starter on numbers against a Tampa Bay starter whose Rays version has been much better than his full season line. Messick has the clear edge in strikeouts and season run prevention. Peralta has the home park, the better recent control, and a lineup behind him that scored 58 more runs than Cleveland's in the regular season.

Advanced Stats & Style Profile

Cleveland Guardians (2026)

Record85, 77
Run differential+11
Runs scored / allowed678 / 667
AVG / OBP / SLG.239 / .316 / .380
Team wRC+ (FanGraphs)97
Home runs / steals / walks162 / 146 / 574
Team ERA / WHIP3.77 / 1.26
Pitching strikeouts1,530
Messick ERA / FIP / WHIP2.56 / 3.06 / 1.06

Tampa Bay Rays (2026)

Record98, 64
Run differential+86
Runs scored / allowed736 / 650
AVG / OBP / SLG.258 / .326 / .402
Team wRC+ (FanGraphs)104
Home runs / steals / walks169 / 164 / 514
Team ERA / WHIP3.70 / 1.14
Pitching strikeouts1,322
Peralta ERA / FIP / WHIP4.42 / 4.28 / 1.33

At the plate Tampa Bay is the better offense, but not by as much as the run totals suggest. FanGraphs has the Rays at a 104 wRC+ and Cleveland at 97, where 100 is league average, so the gap is about seven points once park and league are accounted for. Both teams run a lot, 164 steals for Tampa Bay and 146 for Cleveland, and both are light on power, with 169 and 162 home runs. The Rays get there with contact: they struck out 1,145 times against Cleveland's 1,271 and hit .258 to Cleveland's .239. The Guardians draw more walks, 574 to 514.

The Rays lineup runs through Junior Caminero, who hit .276 with 42 home runs, 101 RBI and an .884 OPS. Yandy Diaz (.805 OPS, 22 homers), Jonathan Aranda (.792, 22 homers, 92 RBI) and Liam Hicks (.795) fill in around him, and Chandler Simpson hit .306 with 46 steals at the top. Cleveland's best regular season bat was Chase DeLauter, .287 with an .820 OPS, and he was the best hitter on the field in Game 1. Steven Kwan got on base at a .382 clip, Angel Martinez hit 18 homers, and Jose Ramirez had an unusual year, a .688 OPS but 37 steals. Ramirez was 3 for 5 on Monday.

On the mound the season numbers are close: a 3.70 ERA for Tampa Bay and 3.77 for Cleveland. The styles aren't. Rays pitchers allowed a 1.14 WHIP but 201 home runs, the most of these two staffs by a wide margin. Cleveland's staff struck out 1,530 hitters, 208 more than Tampa Bay, but walked 530 and hit 74 batters. The Rays bullpen closed with 58 saves in the regular season and Baker has saved every Tampa Bay win this October, which is why Monday's late collapse stood out.

Keys To The Game

Guardians Keys
Messick throws strikes. Six walks in 6.2 postseason innings is the only thing that has slowed him down. Against Tampa Bay this season he walked two in 13.1 innings.
Keep the line moving. Fourteen hits on Monday came mostly without the long ball. A contact first approach against Peralta, who has allowed a .208 average with the Rays, has to stay patient.
Get to the Rays bullpen. Wells and Sulser combined to allow five runs in one inning of work on Monday. Making Peralta work early is how Cleveland gets back there.
Rays Keys
Peralta goes five plus. With McClanahan out, the Rays need length from the starter before heading to Cleveland for three games.
Caminero does damage. He went 1 for 4 with two strikeouts on Monday. Messick held Tampa Bay to two earned runs in 13.1 innings this season, so one swing may be all the Rays get.
Use the speed. Simpson's 46 steals and the Rays' 164 as a team put pressure on a left hander who has struggled with walks this month.

Market Context

DraftKings, as shown in ESPN's odds feed at 11:14 AM Pacific, has Tampa Bay -136 and Cleveland +113. The line opened Rays -134 and Guardians +111, so it has barely moved, two cents toward the home team. At -136 the Rays are implied at 57.6 percent before the vig comes out. ESPN's matchup predictor sees it the other way, giving Cleveland a 53.3 percent chance to win, so the model and the market disagree on who the favorite should be.

The run line is quiet too. Rays -1.5 opened at +163 and sits at +159, with Cleveland +1.5 moving from -199 to -194. The total opened at 7 and is still 7, with the under juice ticking from -115 to -117, which fits a matchup between a 2.56 ERA starter and a pitcher with a 1.69 ERA in his home park as a Ray. Playoff lines can still move once lineups post, so check them again before first pitch.

Final Thoughts

The case for Tampa Bay is the case it had before Monday: the better record, the better lineup by wRC+, a 55 and 26 home record, a 5 and 1 season series, and a starter who has been a different pitcher since he put on a Rays uniform. The case for Cleveland is that the Guardians have the best pitcher in this game on season numbers, he has already shut this lineup down twice, and the Rays bullpen just gave up five runs in an inning of work.

The cleanest way to read it: if Messick finds the strike zone the way he did all summer, Tampa Bay's contact heavy lineup has had very little answer for him, and Cleveland can go home up two games with three straight in its own park. If his October walk problem follows him into the first two innings, the Rays have the speed and the home park to punish it, and Peralta only needs to hand a lead to Baker.

This page is analysis only and carries no pick. Every BetLegend play is posted separately before the game and graded when it goes final at trustmyrecord.com.

Where Every Number Came From

Verification note (October 13, 2026, read between 11:13 and 11:25 AM PT). First pitch time, venue, TBS and truTV, records, home and road records, probable starters, the series score, ESPN's injury list and the matchup predictor come from ESPN's MLB game summary for event 401908024. The DraftKings open and current moneyline, run line and total come from ESPN's odds feed for the same event, read at 11:14 AM PT. Probable starters, broadcast and the Game 3 time were confirmed against MLB's schedule feed (game 849813 and the ALCS schedule). Standings, run differential, last ten records, one run records and home and road splits come from MLB's 2026 regular season standings. Team batting and pitching lines come from MLB's team season stats; player batting lines from MLB's active roster stats. Messick's and Peralta's season lines, game logs, home and road and platoon splits and postseason starts come from MLB's pitcher stats feeds; Peralta's trade date comes from MLB's transaction log. Game 1 details come from MLB's box score and line score for game 849820, and the division series results from MLB's schedule feed. The regular season series comes from MLB's 2026 schedule for these two teams. FIP is calculated as (13 x HR + 3 x (BB + HBP), less 2 x K) divided by innings, plus a league constant of 3.09 derived from MLB's 2026 league pitching totals. Team wRC+ (104 for Tampa Bay, 97 for Cleveland) comes from FanGraphs' 2026 team batting pages for both clubs, read at about 11:20 AM PT; the plate appearances, home runs, steals, on base and slugging on those pages match MLB's regular season team totals exactly.

Frequently Asked Questions

What time is Guardians vs Rays ALCS Game 2 on October 13, 2026?
Tuesday, October 13, 2026 at 5:00 PM Pacific (8:00 PM Eastern) at Tropicana Field in St. Petersburg, Florida, on TBS and truTV.
What are the betting odds for Guardians vs Rays Game 2?
At DraftKings via ESPN, read 11:14 AM Pacific on October 13: Rays -136 and Guardians +113 on the moneyline, Rays -1.5 at +159 and Guardians +1.5 at -194 on the run line, and a total of 7 with the over -103 and the under -117. The Rays opened -134 and the total opened at 7.
What is the ALCS series score between the Guardians and Rays?
Cleveland leads 1 game to 0 after winning Game 1 7 to 3 at Tropicana Field on October 12. Games 3, 4 and 5 are in Cleveland, with Game 3 on Thursday, October 15 at 3:00 PM Pacific.
Who are the starting pitchers for Guardians vs Rays Game 2?
Parker Messick for Cleveland (12 and 9, 2.56 ERA, 1.06 WHIP, 193 strikeouts in 186.1 innings) and Freddy Peralta for Tampa Bay (10 and 11, 4.42 ERA overall, 3.25 ERA and 1.01 WHIP in 10 starts with the Rays).
Who are the key players to watch?
For Cleveland, Chase DeLauter (.820 regular season OPS, 3 for 4 with a home run in Game 1), Jose Ramirez (37 steals, 3 for 5 in Game 1) and Steven Kwan (.382 on base percentage). For Tampa Bay, Junior Caminero (42 home runs, 101 RBI, .884 OPS), Yandy Diaz, Jonathan Aranda and Chandler Simpson (46 steals).
How did the Guardians and Rays do against each other in the 2026 regular season?
Tampa Bay won the season series 5 games to 1 and outscored Cleveland 20 to 8, including a three game sweep at Tropicana Field on July 24 through 26.

Link to this breakdown

NFL | Sunday, October 11

Ravens vs Falcons on Sunday Night Football: Lamar Jackson Is Out, The Line Swung 7.5 Points, And Atlanta Has Scored 80 Points In Two Games Since Penix Took Over

Baltimore Ravens at Atlanta Falcons, Week 5 Sunday Night Football, Featured Game of the Day

Baltimore opened as a 4.5 point road favorite in Atlanta. Then Lamar Jackson was ruled out with an ankle injury, and the Falcons are now 3 point favorites at DraftKings with the total down from 48.5 to 43.5. Tyler Huntley starts for a 3 and 1 Ravens team against a 2 and 2 Atlanta team that has scored 80 points in two games since Michael Penix Jr. took over and owns the best run defense in the league by EPA. Here is what the numbers say about a game that looks nothing like it did when the line opened.

Atlanta Falcons running back Bijan Robinson carries the ball through the New Orleans Saints defense in Atlanta's Week 4 win
Bijan Robinson breaks into the open against New Orleans in Atlanta's 45 to 24 Week 4 win, the run game Baltimore has to slow on Sunday night | Photo: Morgan Simmons/Getty Images via ESPN

Baltimore Ravens Ravens vs Falcons Atlanta Falcons

Sunday, October 11, 2026 | 5:20 PM PT / 8:20 PM ET | Mercedes Benz Stadium, Atlanta, GA | NBC
Baltimore Ravens 3 and 1 | Atlanta Falcons 2 and 2 | Lamar Jackson (QB) OUT, Tyler Huntley starts
Moneyline
BAL +145 / ATL -175
Spread
BAL +3 (+100) / ATL -3 (-120)
Total
43.5
Implied Probability
BAL 40.8% / ATL 63.6%
Lines: DraftKings via ESPN, read 8:35 AM PT. Bovada at 8:47 AM PT: BAL +3.5 (-120), ATL -3.5 (EVEN), BAL +150 / ATL -175, total 43.5.

The Line That Flipped

When this number first went up, Baltimore was the favorite. DraftKings opened the Ravens at -4.5 on the road with a moneyline of -218 and a total of 48.5. This morning Atlanta is the favorite at -3, the Falcons are -175 on the moneyline, and the total has dropped five full points to 43.5. That is a 7.5 point swing on the spread, and it comes down to one name on the injury report. Lamar Jackson is out with an ankle injury, and Tyler Huntley makes the start on Sunday Night Football.

Baltimore comes in at 3 and 1, tied with Cleveland atop the AFC North. The Ravens won 41 to 23 at Indianapolis in Week 1, lost 24 to 17 at home to New Orleans, then beat Dallas 34 to 31 and Tennessee 24 to 18. They have scored 116 points and allowed 96. Atlanta is 2 and 2, tied with Carolina atop the NFC South, and its season splits cleanly into two halves. With Cooper Rush and Jack Strand taking the snaps, the Falcons lost 20 to 13 at Pittsburgh and 34 to 3 at home to Carolina. Michael Penix Jr. took over in Week 3, and Atlanta has since won 35 to 14 at Green Bay and 45 to 24 at New Orleans. That is 16 points in the first two games and 80 in the last two.

So the story of this game is two quarterback situations moving in opposite directions. Atlanta has found its guy, and Baltimore has lost its guy for at least one week. The question for anyone handicapping it is how much of each team's season numbers still apply on Sunday night.

Injury Report & Lineup Notes

Baltimore Ravens
Out
Lamar Jackson OUT (ankle), Cam Jurgens OUT (concussion), Trey Hendrickson OUT (finger)
Questionable
WR Zay Flowers (foot), CB Marlon Humphrey (calf)
Starting QB
Tyler Huntley, per ESPN's Friday report. Huntley went 8 of 9 for 63 yards in relief in Week 4.
Atlanta Falcons
Out
Za'Darius Smith OUT (concussion); LB Yasir Abdullah on injured reserve (hamstring)
Questionable
Jake Matthews Questionable (groin), LB Divine Deablo (hamstring), DE Samson Ebukam (hamstring)
Watch
ESPN reports Matthews is chasing his 200th consecutive start, the longest active iron man streak in the league.

The Jackson news is the headline, but Baltimore's list runs deeper than the quarterback. Cam Jurgens, who just arrived in a trade with Philadelphia, is out with a concussion, so the Ravens are breaking in a backup quarterback behind a center change. Trey Hendrickson is out with a finger injury, which takes a pass rusher off the field against a quarterback who has been carving people up. Zay Flowers, Baltimore's leading receiver, is questionable with a foot injury, and if he sits, Huntley loses his most reliable target in his first start of the season. On the other side, Atlanta loses Za'Darius Smith, who leads the team with 2.5 sacks, and has three more players listed as questionable, including left tackle Jake Matthews. Check the inactive list about 90 minutes before kickoff, around 3:50 PM PT.

Huntley, Penix And Two Run Games

Baltimore without Lamar

It is hard to overstate how much of Baltimore's offense ran through Jackson. He threw for 967 yards with 6 touchdowns and 1 interception on 68 of 96 passing, and the Ravens rank 2nd in the league in EPA per pass play at 0.337. Take him out and the offense leans much harder on Derrick Henry, who has 374 yards and 7 touchdowns on 89 carries. Here is the catch: Henry has found the end zone 7 times, but per play by play data his carries average slightly below zero EPA (-0.05 per rush), and Atlanta's run defense is the best in the league by EPA per rush at -0.234. If the Falcons take away the early down run, Huntley ends up in long third downs, and the Ravens have converted only 12 of 36 third down snaps all season even with Jackson.

ESPN reports head coach Jesse Minter expects Huntley to play well. His Week 4 relief work was tidy, 8 of 9 for 63 yards, but that was a short field sample against Tennessee. What he gives you is mobility and quick game timing. What he does not give you is the downfield threat that makes defenses respect every inch of the field.

Atlanta with Penix

Atlanta's full season passing numbers are misleading. As a team the Falcons rank 31st in EPA per pass play at -0.191, but almost all of that damage came in Weeks 1 and 2, when Rush and Strand combined for roughly -0.67 EPA per dropback and Atlanta threw five interceptions. In two games Penix has posted about +0.37 and +0.51 EPA per dropback, going 33 of 45 for 479 yards with 2 touchdowns and 1 interception. Those are elite numbers, in a small sample, against Green Bay and New Orleans.

The engine underneath it is Bijan Robinson, with 494 rushing yards and 4 touchdowns on 85 carries, plus Brian Robinson with 194 yards on 44 carries. Atlanta ranks 4th in EPA per rush. Drake London has 20 catches for 370 yards. Baltimore's run defense sits right at league average, 16th in EPA per rush, and Roquan Smith leads the Ravens with 34 tackles. That is where this game is most likely to tilt.

Advanced Stats & Style Profile

Baltimore Ravens

Offense EPA per play0.186 (3rd)
Offense success rate51.7% (2nd)
Yards per play (pass and rush)6.83
EPA per pass / per rush0.337 (2nd) / 0.050 (6th)
Defense EPA per play-0.016 (11th)
Defense success rate allowed43.1% (13th)
Defense EPA per rush-0.050 (16th)
Giveaways / takeaways2 / 5
Sacks7

Atlanta Falcons

Offense EPA per play-0.024 (18th)
Offense success rate49.4% (5th)
Yards per play (pass and rush)5.96
EPA per pass / per rush-0.191 (31st) / 0.111 (4th)
Defense EPA per play-0.057 (8th)
Defense success rate allowed38.1% (3rd)
Defense EPA per rush-0.234 (1st)
Giveaways / takeaways8 / 3
Sacks7

On paper Baltimore has the better offense by a wide margin, 3rd in EPA per play against Atlanta's 18th. But the Ravens' number was built with Jackson throwing, and the Falcons' number is dragged down by two games that no longer describe them. Flip both adjustments and the picture gets much closer. The one number that does not depend on quarterbacks is Atlanta's defense, which allows the 3rd lowest success rate in the league and has been the best run defense in football. Baltimore has protected the ball (2 giveaways in four games) while Atlanta has given it away 8 times, and only one of its 6 interceptions came from Penix.

Keys To The Game

Ravens Keys
Stay ahead of the chains. A 33% third down rate with Jackson will not survive with Huntley if Atlanta wins first down against Henry.
Keep the turnover edge. Two giveaways all year is a big part of 3 and 1. A backup quarterback on the road at night has to keep it that way.
Slow Bijan without Hendrickson. A league average run defense is facing the 4th best rushing offense by EPA.
Falcons Keys
Make Huntley throw. The best run defense in the league is the perfect tool against an offense that just lost its passer.
Keep Penix clean. Jake Matthews is questionable at left tackle, and the passing game has been elite only in a two game sample.
Replace Za'Darius Smith's rush. The team sack leader is out, and Ebukam and Deablo are both questionable.

Market Context

DraftKings opened Baltimore -4.5 and now deals Atlanta -3 at -120, with Baltimore +3 at even money. The Falcons are -175 and the Ravens +145 on the moneyline, which works out to implied probabilities of 63.6% and 40.8% before removing the hold. Bovada is a half point higher on Atlanta, -3.5 at even money, with the same -175 on the Falcons and +150 on the Ravens. The total opened 48.5 and sits at 43.5 at both books. ESPN's matchup predictor gives Atlanta a 59.9% win probability.

The juice tells you where the pressure is. At -120 on Atlanta -3 at DraftKings and a flat 3.5 at Bovada, the market is leaning toward the hook rather than off it. The five point drop on the total is the market pricing a slower, run heavy Baltimore game script with Huntley under center against a defense that has shut down the run.

Final Thoughts

This is a rare game where both teams' season numbers need an asterisk. Baltimore's elite offense was a Lamar Jackson offense, and Sunday night it is a Tyler Huntley offense with a new center and a questionable top receiver. Atlanta's ugly passing profile was a Cooper Rush profile, and the Falcons have looked like a different team in two games with Penix. The market has already moved 7.5 points to account for all of it. The real handicap is whether Atlanta's two week surge and its run defense are worth more than a field goal against a Ravens team that still has Henry, still protects the ball and is still 3 and 1.

This page is analysis only and carries no pick. Every BetLegend play is posted separately before kickoff and graded when the game goes final at trustmyrecord.com.

Where Every Number Came From

Verification note (October 11, 2026, read between 8:30 and 8:50 AM PT). Kickoff time, venue, NBC, records, AFC North and NFC South standings, points for and against, the last five game scores, team leaders (Jackson, Henry, Flowers, Roquan Smith, Tavius Robinson, Penix, Bijan Robinson, London, Za'Darius Smith, Watts), the injury report with statuses and ESPN's matchup predictor come from ESPN's NFL scoreboard and game summary for event 401872993. The DraftKings open and current spread, moneyline and total come from ESPN's odds feed for the same event, read at 8:35 AM PT. Bovada lines were read from Bovada's NFL game lines feed at 8:47 AM PT. Huntley as the starter, Jurgens' trade from Philadelphia, Minter's comments and the Matthews start streak come from ESPN's Ravens and Falcons news feeds. EPA per play, success rate, yards per play on pass and rush plays, the pass and rush EPA splits, quarterback splits by week (including Huntley's 8 of 9 for 63 yards and Brian Robinson's 194 yards on 44 carries), sacks, giveaways, takeaways and third down conversions are calculated from the nflverse 2026 play by play file (regular season games through October 8, pass and rush plays with EPA), with ranks out of 32. Implied probabilities are math on the DraftKings moneylines. Lines move; check your book before kickoff.

Frequently Asked Questions

What time is Ravens vs Falcons on October 11, 2026?
Sunday, October 11, 2026 at 5:20 PM Pacific (8:20 PM Eastern) at Mercedes Benz Stadium in Atlanta, on NBC. It is the Week 5 Sunday Night Football game.
What are the betting odds for Ravens vs Falcons?
At DraftKings (via ESPN, read 8:35 AM PT) Atlanta is -3 at -120 with Baltimore +3 at even money, the moneyline is Atlanta -175 and Baltimore +145, and the total is 43.5. The line opened Baltimore -4.5 with a total of 48.5. Bovada has Atlanta -3.5 at even money, Atlanta -175 and Baltimore +150, total 43.5.
Is Lamar Jackson playing against the Falcons?
No. Lamar Jackson is out with an ankle injury and Tyler Huntley starts at quarterback for Baltimore. Center Cam Jurgens and Trey Hendrickson are also out, and receiver Zay Flowers and cornerback Marlon Humphrey are questionable.
What are the Ravens and Falcons records?
Baltimore is 3 and 1, with wins of 41 to 23 at Indianapolis, 34 to 31 over Dallas and 24 to 18 over Tennessee and a 24 to 17 loss to New Orleans. Atlanta is 2 and 2: losses of 20 to 13 at Pittsburgh and 34 to 3 to Carolina, then wins of 35 to 14 at Green Bay and 45 to 24 at New Orleans.
Who are the key players to watch?
For Atlanta: Michael Penix Jr. (479 passing yards, 2 touchdowns in two games), Bijan Robinson (494 rushing yards, 4 touchdowns) and Drake London (20 catches, 370 yards). For Baltimore: Tyler Huntley at quarterback, Derrick Henry (374 rushing yards, 7 touchdowns), Zay Flowers (352 receiving yards, questionable) and Roquan Smith (34 tackles).
Who is injured for the Falcons?
Per the ESPN injury report, Atlanta has defensive end Za'Darius Smith out with a concussion and linebacker Yasir Abdullah on injured reserve, with tackle Jake Matthews, linebacker Divine Deablo and defensive end Samson Ebukam questionable.

Link to this breakdown

NCAAF Regular Season | Saturday, October 10

Georgia vs Alabama: Two Unbeaten Offenses, A Five And A Half Point Line Flip, And The Best Defense In The Game On The Road

#2 Georgia Bulldogs at #6 Alabama Crimson Tide, SEC Saturday Night, Featured Game of the Day

Both teams walk into Bryant Denny Stadium at 5 and 0, and both have been scoring at a rate that makes the number on the board look small. Georgia is putting up 51.4 points a game and allowing 13.4. Alabama is putting up 49.6 and allowing 20.8. What makes this one interesting for anybody watching the market is that the favorite changed sides: DraftKings opened Georgia a 3 point favorite at -142 on the moneyline, and the game now sits at Alabama -2.5 with the Tide -122. That's a five and a half point move through the key number, toward the home team, on a total that hasn't budged from 51.5.

Alabama receiver Ryan Williams scoring the game winning touchdown against Georgia at Bryant Denny Stadium
Alabama's Ryan Williams scores the game winning touchdown against Georgia in their 2024 meeting in Tuscaloosa. | Photo: The University of Alabama, CC BY 3.0, via Wikimedia Commons

Georgia Bulldogs Georgia vs Alabama Alabama Crimson Tide

Saturday, October 10, 2026 | 7:30 PM ET (4:30 PM PT) | Bryant Denny Stadium, Tuscaloosa, AL | ABC
#2 Georgia (5 and 0) at #6 Alabama (5 and 0)
Moneyline
UGA +102 / ALA -122
Spread
ALA -2.5 (-105)
Total
51.5 (o -108 / u -112)
Implied Probability
ALA 55.0% / UGA 49.5%

Two Unbeatens, One Has Been Tested

Start with the schedules, because the records are identical and the paths are not. Alabama has played two road games already, winning 45 to 17 at Kentucky and 56 to 23 at Mississippi State, and it survived the one real shootout on its card, a 50 to 36 home win over Florida State. The Tide also beat East Carolina 48 to 10 and South Carolina 49 to 18. That's 45 points or more in all five games and 248 points total.

Georgia's run has been even more lopsided on the scoreboard. The Bulldogs beat Tennessee State 63 to 3 and Western Kentucky 70 to 20, then won 45 to 17 at Arkansas, 41 to 13 over Oklahoma and 38 to 14 over Vanderbilt. They've allowed just 67 points in five games. The catch is that Georgia's only road game so far was in Fayetteville, and this is a different kind of building. Alabama, meanwhile, has already had to finish a game where the other team scored 36.

So the question this game answers is a simple one. Is Georgia's defense really the best unit on the field, or has it mostly been the best unit against the people it has played? Alabama's offense is the first one it faces that has scored 45 every week.

Injury Report & Lineup Notes

Georgia Bulldogs
Availability
ESPN's injury feed listed no Georgia players as of early Saturday, October 10. The SEC availability report comes out before kickoff; check it before relying on any individual player.
Alabama Crimson Tide
Availability
ESPN's injury feed listed no Alabama players as of early Saturday, October 10. Same caution: the SEC availability report is the final word before kickoff.

Quarterback And Trench Matchup

Georgia: efficient, balanced, and hard to stop on the ground

Gunner Stockton has been about as clean as a quarterback can be through five games: 77 of 102 for 1,049 yards, 13 touchdowns and one interception. Georgia doesn't need him to throw 40 times, because the run game is doing the heavy lifting. The Bulldogs average 213.0 rushing yards a game at 6.5 yards a carry, and Nate Frazier has 211 yards and five touchdowns on just 26 carries. Craig Dandridge leads the receivers with 177 yards on nine catches. Georgia's line has allowed only 5 sacks all season.

Alabama: the more explosive passing game

Keelon Russell has thrown for 1,414 yards on 94 of 132 with 11 touchdowns and two interceptions, and Alabama averages 10.6 yards per pass attempt as a team. Ryan Coleman Williams is the big play target with 376 yards and four touchdowns on 20 catches. The ground game is solid rather than dominant at 186.4 yards a game and 4.9 a carry, with Daniel Hill at 247 yards and four scores. The concern is protection: Alabama has given up 12 sacks, more than twice Georgia's total.

Put those together and the trench battle is the game. Georgia's defense allows only 57.4 rushing yards a game, so Alabama probably can't lean on Hill to set things up. That puts it on Russell, behind a line that has been leaky, against a Georgia front where Raylen Wilson already has three sacks and a team high 27 tackles. On the other side, Alabama's defense allows 78.6 rushing yards a game and has 16 sacks of its own, with Devan Thompkins at three. If the Tide can make Georgia one dimensional, Stockton has to win it with his arm for the first time this season.

Advanced Stats & Style Profile

Georgia Bulldogs

Points per game / allowed51.4 / 13.4
Yards per game / allowed478.8 / 244.6
Yards per play (ESPN totals)7.80 (2,394 on 307)
Rush yards per game / per carry213.0 / 6.5
Pass yards per game / per attempt265.8 / 9.6
Rush / pass yards allowed per game57.4 / 187.2
Third down conversion54.9%
Sacks allowed / sacks made5 / 13
Turnover margin+3 (7 takeaways, 4 giveaways)

Alabama Crimson Tide

Points per game / allowed49.6 / 20.8
Yards per game / allowed473.8 / 312.6
Yards per play (ESPN totals)6.97 (2,369 on 340)
Rush yards per game / per carry186.4 / 4.9
Pass yards per game / per attempt287.4 / 10.6
Rush / pass yards allowed per game78.6 / 234.0
Third down conversion49.1%
Sacks allowed / sacks made12 / 16
Turnover margin+1 (7 takeaways, 6 giveaways)

On paper Georgia is better in almost every row. It gains nearly a full yard more per play, converts more third downs, protects the quarterback far better and gives up about 68 fewer yards a game. Alabama's edges are the explosive passing game, 10.6 yards per attempt against Georgia's 9.6, the pass rush, and eight interceptions on defense to Georgia's four. The honest caveat is the schedule. Georgia's numbers include 63 and 70 point wins over Tennessee State and Western Kentucky, and Alabama's defense is the one that gave up 36 to Florida State. Neither defense has seen anything like the offense across the field tonight.

Keys To The Game

Georgia Keys
Stay ahead of the chains. A 54.9% third down rate and 6.5 yards a carry let Georgia shorten the game and keep Russell on the sideline.
Handle the noise early. One interception in 102 attempts says Stockton won't give it away; the first two drives in Tuscaloosa will show whether that holds on the road at night.
Get home on Russell. Alabama has allowed 12 sacks. Raylen Wilson and the Georgia front turning drives into third and long is the cleanest path to a road win.
Alabama Keys
Hit the shots. 10.6 yards per attempt and Coleman Williams at 18.8 yards a catch are how you score on a defense allowing 57.4 rushing yards a game.
Protect the edges. The difference between a good night and a bad one for Russell is the sack total; 12 in five games won't work against this front.
Make Georgia throw. Alabama's run defense has held up at 78.6 yards a game. Slow Frazier down and force Stockton into obvious passing downs.

Market Context

This is the most interesting part of the game. DraftKings, via ESPN, opened Georgia -3 with the Bulldogs -142 on the moneyline and Alabama +120. It now reads Alabama -2.5 at -105, with the Tide -122 and Georgia +102. That's a swing of five and a half points, straight across the 3, which is rare in a game this big. The total opened and still sits at 51.5, with the over price moving from -102 to -108.

ESPN's matchup predictor is much less convinced, giving Alabama a 51.8% chance to win, basically a coin flip. The current moneyline implies about 55% for Alabama before the hold. So the market has moved past where the model sits. Anyone looking at Georgia is getting the number two team in the country at plus money on the road, and anyone looking at Alabama is paying for a line that has already moved more than five points toward them.

Final Thoughts

Strip away the rankings and this is a clean contrast. Georgia is the more complete team on a per play basis, with the better run game, the better protection, the better third down offense and a defense that hasn't been bent yet. Alabama is the more explosive passing team, it has the home crowd, and it has already proven it can win a game that turns into a track meet. The market has made its call by flipping the favorite, and the total says nobody expects either defense to fully shut the other down.

The things worth watching early are Alabama's protection on the first few dropbacks and whether Georgia can run on first down. If Russell is upright and Frazier is getting stopped for two and three yards, the home team is in control. If Georgia is averaging six a carry by the second quarter, the line move will look like an overreaction.

FAQ

What time is Georgia vs Alabama on October 10, 2026?
Kickoff is 7:30 PM Eastern, 4:30 PM Pacific, on Saturday, October 10, 2026 at Bryant Denny Stadium in Tuscaloosa, on ABC.
What are the betting odds for Georgia vs Alabama?
DraftKings via ESPN has Alabama -2.5 (-105), Alabama -122 and Georgia +102 on the moneyline, and a total of 51.5. The game opened Georgia -3, -142 on the moneyline.
What are Georgia's and Alabama's records?
Both teams are 5 and 0. Georgia is ranked second and Alabama sixth. Georgia averages 51.4 points and allows 13.4; Alabama averages 49.6 and allows 20.8.
Where is the game played?
Bryant Denny Stadium in Tuscaloosa, Alabama, where Alabama has won all three of its home games this season.
Who are the key players to watch?
Georgia quarterback Gunner Stockton (1,049 yards, 13 touchdowns, 1 interception), running back Nate Frazier and linebacker Raylen Wilson; Alabama quarterback Keelon Russell (1,414 yards, 11 touchdowns), receiver Ryan Coleman Williams and pass rusher Devan Thompkins.
Why did the line move toward Alabama?
The market moved from Georgia -3 to Alabama -2.5 between the open and Saturday morning. Sportsbooks do not publish why; the move crossed the key number of 3 while the total stayed at 51.5.

Link to this breakdown

NCAAF Regular Season | Friday, October 9

Iowa vs Washington: The Hawkeyes Run It, The Huskies Throw It, And The Market Moved Toward Seattle

#20 Iowa Hawkeyes at Washington Huskies, Big Ten Friday Night Football, Featured Game of the Day

Iowa flies to Seattle at 4 and 1 with the best scoring defense in this game by a wide margin, and Washington comes in at 3 and 2 off two straight losses by a combined seven points. You'd expect the ranked team to be getting respect. Instead the money went the other way: DraftKings opened Washington a 1.5 point favorite and has the Huskies at 3 now, while ESPN's own matchup predictor makes Iowa a 60.2 percent winner. Two very different offenses, one very slow total, and a market that disagrees with the model. That's the game.

Husky Stadium seen across Union Bay in Seattle, where the Washington Huskies host the Iowa Hawkeyes on Friday night
Husky Stadium across Union Bay in Seattle, where Iowa plays Washington under the lights on Friday | Photo: Visitor7, CC BY SA 3.0, via Wikimedia Commons

Iowa Hawkeyes Iowa vs Washington Washington Huskies

Friday, October 9, 2026 | 6:00 PM PT / 9:00 PM ET | Husky Stadium, Seattle, WA | FOX
#20 Iowa Hawkeyes (4-1), 1 and 1 Big Ten | Washington Huskies (3-2), 0 and 2 Big Ten
Moneyline
IOWA +124 / WASH -148
Spread
IOWA +3 (-118) / WASH -3 (-102)
Total
41.5 (O -108 / U -112)
Implied Probability
IOWA 44.6% / WASH 59.7%
Lines: DraftKings via ESPN, read 2:12 PM PT on October 9.

Matchup Context

Iowa's season has been built on defense. The Hawkeyes shut out Northern Illinois 40 to 0, survived Iowa State 16 to 13, blanked Northern Iowa 55 to 0, then went into Ann Arbor and beat Michigan 20 to 19. Last Saturday Ohio State came to Kinnick and won 31 to 14, the first time all year anyone scored more than 19 on this defense. Season to date, Iowa scores 29.0 points a game and allows 12.6. Those numbers are padded by two shutouts, though. Against Iowa State, Michigan and Ohio State, Iowa has scored 50 points total and allowed 63.

Washington is the harder team to read. The Huskies opened 3 and 0 at home with wins over Washington State 24 to 10, Utah State 16 to 14 and Eastern Washington 48 to 16. Then Minnesota beat them 27 to 24 in Seattle and USC beat them 25 to 21 in Los Angeles. So they're 0 and 2 in the Big Ten, both losses by one score, and Friday is the first chance to stop a slide before the season gets away. They score 26.6 a game and allow 18.4. Iowa is 1 and 1 in conference with a ranking to protect and its only loss coming against Ohio State.

Injury Report & Lineup Notes

Iowa Hawkeyes
Availability
ESPN's game summary for this matchup carried no injury listings for Iowa at 2:12 PM PT. College football has no mandatory public injury report like the NFL's, so treat that as no information, not a clean bill of health. Hank Brown is Iowa's passing leader and Kamari Moulton its leading rusher.
Washington Huskies
Availability
ESPN's game summary carried no injury listings for Washington either. Demond Williams Jr. leads the team in passing, Brian Bonner Jr. in rushing and Dezmen Roebuck in receiving. Check final availability before kickoff.

Hank Brown's Ground Game Against Demond Williams Jr.'s Arm

Iowa: run first, then run some more

Iowa averages 180.2 rushing yards a game on 5.9 yards a carry per ESPN, and it has run the ball 153 times against 160 pass attempts. Kamari Moulton has 311 yards on 50 carries with 2 touchdowns. Hank Brown is efficient more than explosive: 78 of 124 for 832 yards, 5 touchdowns and 1 interception, which works out to about 6.7 yards an attempt. Tony Diaz is the top target with 25 catches for 306 yards. The line has protected Brown well, too. ESPN credits Iowa with just 5 sacks allowed all season.

The problem is that the run game has looked very different against good teams. TeamRankings has Iowa at 4.6 yards per play over its last three games and 4.3 against Ohio State. Washington's run defense allows 111.4 yards a game, so this isn't a soft front. If Iowa can't stay ahead of the chains on first and second down, Brown has to throw into a secondary ESPN credits with 7 interceptions.

Washington: Williams and the passing game carry the offense

Washington is the opposite. The Huskies throw for 271.4 yards a game at 8.1 yards an attempt, and Demond Williams Jr. is 110 of 163 for 1,327 yards with 8 touchdowns and 3 interceptions. Dezmen Roebuck has 35 catches for 338 yards. The run game is the weak spot: 109.0 yards a game on just 3.7 a carry, with Brian Bonner Jr. leading the way at 215 yards on 41 carries.

And here's the matchup that probably decides the night. Washington has allowed 15 sacks for 73 yards in five games. Iowa's defense has 13 sacks, with Joseph Anderson at 3. Iowa gives up only 186.4 passing yards a game. If the Hawkeyes can get home on obvious passing downs, Washington's one real weapon gets a lot smaller.

Advanced Stats & Style Profile

Iowa Hawkeyes

Points per game / allowed29.0 / 12.6
Yards per game / allowed390.8 / 288.6
Rush yards per game / per carry180.2 / 5.9
Pass yards per game / per attempt210.6 / 6.6
Yards per play (ESPN totals)6.14 (1,954 on 318)
Yards per play (TeamRankings)5.2, 82nd
Opponent yards per play (TeamRankings)4.9, 40th
Third down25 of 62, 40.3%
Sacks allowed / sacks made5 / 13
Penalties29 for 247 yards

Washington Huskies

Points per game / allowed26.6 / 18.4
Yards per game / allowed380.4 / 303.4
Rush yards per game / per carry109.0 / 3.7
Pass yards per game / per attempt271.4 / 8.1
Yards per play (ESPN totals)5.76 (1,902 on 330)
Yards per play (TeamRankings)5.1, 89th
Opponent yards per play (TeamRankings)4.8, 31st
Third down18 of 62, 29.0%
Sacks allowed / sacks made15 / 10
Penalties41 for 389 yards

Two things jump out. First, these defenses are closer than the points allowed suggest. Iowa's 12.6 points allowed looks elite, but TeamRankings has the two defenses within a tenth of a yard per play of each other, with Washington actually ranked higher at 31st to Iowa's 40th. Second, Washington's offense has a real third down problem: 29.0 percent, against Iowa's 40.3. A team that throws for 8.1 yards an attempt shouldn't be stalling that often, and the 15 sacks are a big part of why.

The two yards per play figures don't agree because the sources count differently, so both are shown. ESPN's season totals include every game, and they flatter both offenses. TeamRankings has both teams in the bottom half of the country, which fits a total sitting at 41.5. EPA per play and success rate for these two teams were not available from a source we could read today, so they are left out rather than estimated. ESPN's red zone fields for both teams read zero, which is clearly a feed gap, so red zone numbers are left out too.

Keys To The Game

Iowa Keys
Win first down on the ground. Moulton at 6.2 yards a carry keeps Brown in manageable spots. Fall behind schedule and Iowa looks like the 4.3 yards per play team it was against Ohio State.
Make Williams hold it. Thirteen sacks against a line that has allowed 15 is the clearest edge Iowa has on the board.
Win on the road at night. Iowa's lone road game so far was a one point win at Michigan. Husky Stadium on a Friday night is a different test.
Washington Keys
Protect the quarterback. At 8.1 yards an attempt Williams can beat anybody when he has time. Fifteen sacks says he hasn't had enough of it.
Fix third down. 18 of 62 isn't sustainable against a defense that has allowed 12.6 points a game.
Clean it up. Washington has 41 penalties for 389 yards to Iowa's 29 for 247. In a game with a 41.5 total, giving away field position is costly.

Market Context

DraftKings, as shown on ESPN, opened Washington -1.5 at -110 on both sides, with a moneyline of Washington -118 and Iowa -102. At 2:12 PM PT the spread was Washington -3 at -102 with Iowa +3 at -118, and the moneyline was Washington -148 and Iowa +124. That moneyline implies 59.7 percent for Washington, up from 54.1 percent at the open. The total opened 41.5 and was 41.5 at read time, with the over at -108 and the under at -112.

The juice on Iowa +3 at -118 tells you the book is protecting the key number, so the move to 3 is real. What makes this one interesting is that ESPN's matchup predictor goes the other way, giving Iowa 60.2 percent to win. When the market and a model split by that much, one of them is reading something the other isn't. The market may be weighting Washington's home field and the Ohio State result. The model may be trusting Iowa's full season profile.

Final Thoughts

This is a clean style clash. Iowa wants to run, protect Brown, and lean on a defense that has allowed more than 19 points once all season. Washington wants to throw, and it's been good at that, but a leaky pass protection unit and a 29 percent third down rate have turned close games into losses. Iowa's resume has more quality wins. Washington has the home field and the market behind it. With a total this low, every sack, every third down and every penalty is going to swing things. Analysis only on this page; no pick is made here.

Where Every Number Came From

Verification note (October 9, 2026, read between 2:12 and 2:20 PM PT). Kickoff time, venue, FOX, Iowa's number 20 ranking, overall and Big Ten records, the five most recent game scores, per game team stats (points, yards, passing, rushing and allowed figures), team leaders, the injury listings (none listed), the DraftKings open and current lines and ESPN's matchup predictor come from ESPN's game summary and odds feeds for event 401858487. Rushing and passing attempts, yards per carry, yards per attempt, completion data, sacks allowed, sacks made, interceptions, third down conversions and penalties come from ESPN's 2026 team statistics feeds for Iowa (2294) and Washington (264). ESPN yards per play is ESPN total yards divided by ESPN offensive plays. TeamRankings yards per play, opponent yards per play, the last three and last game splits, and national ranks were read from teamrankings.com. Implied probabilities are math on the DraftKings moneylines. Not available today: EPA per play and success rate (no readable source), and red zone rates (ESPN feed shows zero). Lines move, so check your book before kickoff.

Frequently Asked Questions

What time is Iowa vs Washington on October 9, 2026?
Friday, October 9, 2026 at 6:00 PM Pacific (9:00 PM Eastern) at Husky Stadium in Seattle, on FOX.
What are the betting odds for Iowa vs Washington?
At DraftKings (via ESPN, read 2:12 PM PT) Washington is a 3 point favorite at -102 with Iowa +3 at -118, the moneyline is Washington -148 and Iowa +124, and the total is 41.5. The line opened Washington -1.5 with a moneyline of Washington -118 and Iowa -102, and the total opened 41.5.
What are the Iowa and Washington records?
Iowa is 4 and 1 and 1 and 1 in the Big Ten, ranked 20th. Washington is 3 and 2 and 0 and 2 in the Big Ten, with losses of 27 to 24 to Minnesota and 25 to 21 at USC.
Where is Iowa vs Washington played?
Husky Stadium in Seattle, Washington, home of the Washington Huskies.
Who are the key players to watch?
For Washington: quarterback Demond Williams Jr. (1,327 passing yards, 8 touchdowns, 3 interceptions), receiver Dezmen Roebuck (338 yards) and running back Brian Bonner Jr. (215 yards). For Iowa: quarterback Hank Brown (832 passing yards, 5 touchdowns, 1 interception), running back Kamari Moulton (311 yards, 2 touchdowns), receiver Tony Diaz (306 yards) and edge Joseph Anderson (3 sacks).
Who is favored according to ESPN's matchup predictor?
ESPN's matchup predictor gives Iowa a 60.2 percent chance to win and Washington 39.8 percent, the opposite of the betting market, which has Washington favored by 3.

Link to this breakdown

NFL | Thursday, October 8

Buccaneers vs Cowboys: Baker Mayfield Is Out, The Line Has Tripled, And Tampa Bay Still Has Never Lost By More Than Seven

Tampa Bay Buccaneers at Dallas Cowboys, Week 5 Thursday Night Football, Featured Game of the Day

Tampa Bay comes to Arlington at 0 and 4 with its starting quarterback out with a dislocated thumb, and the market has reacted about as hard as a market can. Dallas opened 3.5 point favorites at DraftKings and sits at 9.5 now. The Cowboys have one of the best offenses in football and one of the worst defenses. The Bucs have one of the worst offenses and one of the best defenses. That's the whole game, and the numbers underneath it are a lot more interesting than the records.

The Dallas Cowboys defense lines up at the line of scrimmage on the field at AT&T Stadium in Arlington, where the Buccaneers visit on Thursday Night Football
The Cowboys defense set at the line of scrimmage at AT&T Stadium, the unit Tampa Bay's backup quarterback has to beat Thursday night | Photo: Carol M. Highsmith, Library of Congress, public domain, via Wikimedia Commons

Tampa Bay Buccaneers Buccaneers vs Cowboys Dallas Cowboys

Thursday, October 8, 2026 | 5:15 PM PT / 8:15 PM ET | AT&T Stadium, Arlington, TX | Prime Video
Tampa Bay Buccaneers 0 and 4, 0 and 1 on the road | Dallas Cowboys 2 and 2, 1 and 1 at home | Baker Mayfield (QB) OUT
Moneyline
DAL -520 / TB +390
Spread
DAL -9.5 (-108) / TB +9.5 (-112)
Total
48.5
Implied Probability
DAL 83.9% / TB 20.4%
Lines: DraftKings via ESPN, read 3:39 PM PT. Bovada at 3:39 PM PT: DAL -9.5 (-105), TB +9.5 (-115), DAL -480 / TB +350, total 49.

Matchup Context

Start with the record, because it lies a little. Tampa Bay is 0 and 4, last in the NFC South behind Carolina and Atlanta at 2 and 2. But look at how they lost. Cincinnati beat them 33 to 27. Cleveland beat them 23 to 19. Minnesota beat them 23 to 16. Green Bay beat them 17 to 14 on Sunday. That's losses by 6, 4, 7 and 3. They've scored 76 points and allowed 96, a minus 20 differential spread over four one score games.

Dallas is 2 and 2 and has been a coin flip in a very different way. The Cowboys lost 28 to 20 at the Giants, blew out Washington 37 to 20, lost a 34 to 31 shootout to Baltimore and then won 34 to 30 in Houston on Sunday. They've scored 122 and allowed 112. Every Dallas game except the opener has had at least 57 total points. The Giants are 3 and 1 on top of the NFC East, so a home win keeps Dallas in the chase and a loss to a winless team would be a real problem.

So you've got a team whose games are low scoring and close against a team whose games are high scoring and wild. One of those identities is going to win out on a short week.

Injury Report & Lineup Notes

Tampa Bay Buccaneers
Baker Mayfield (QB) OUT
Dislocated thumb. Jalon Daniels is next on the depth chart, with Easton Stick behind him.
Antoine Winfield Jr. (S) OUT
Fractured ribs. A starting safety misses a game against CeeDee Lamb.
Benjamin Morrison (CB) OUT
Quadriceps. Another corner gone against an offense throwing for 266.3 yards a game.
SirVocea Dennis (LB) OUT
Ankle. WR Jalen McMillan (knee, PCL sprain) is on injured reserve.
Dallas Cowboys
Drew Shelton (OT) OUT
Hamstring. Tackle depth.
Tyler Smith (G) Questionable
Thumb surgery. The starting guard is the name to watch before kickoff.
DeMarvion Overshown (LB) OUT
Hamstring. A starting linebacker gone from a defense already allowing 150.3 rushing yards a game.
Cobie Durant (CB) OUT
Hamstring. WR Jonathan Mingo is questionable with an illness.

Mayfield is the headline and the reason the line moved six points, but don't skip the Tampa Bay secondary. With Winfield and Morrison both out, the Bucs are asking a thinned out back end to handle Lamb, who already has 37 catches for 498 yards and 4 touchdowns. On the Dallas side, losing Overshown hurts the one thing Tampa Bay might actually want to do, which is run the ball with Bucky Irving and keep Daniels in short yardage.

Jalon Daniels, Dak Prescott And Two Lopsided Units

Tampa Bay with the ball

Here's the uncomfortable part for Bucs backers: the offense wasn't working with Mayfield either. He was 61 of 96 for 615 yards with 2 touchdowns and 2 interceptions, and his dropbacks averaged minus 0.297 EPA. Tampa Bay has been sacked 16 times in four games and has 9 giveaways. The team averages 4.9 net yards per pass attempt.

Daniels has already seen real time. Against Green Bay on Sunday he went 19 of 30 for 148 yards with 1 touchdown and 2 interceptions, and he was sacked 3 times. His dropbacks across the season have averaged minus 0.145 EPA, which is bad, but it's actually less bad than the starter's number. The steadier piece is Irving, who has 241 yards on 56 carries, and a run game at 4.4 yards a carry.

Dallas with the ball

Dak Prescott is 105 of 150 for 1,065 yards with 8 touchdowns and 1 interception, and Dallas dropbacks are averaging plus 0.323 EPA. Lamb is the engine, and Javonte Williams has turned 62 carries into 231 yards and 5 touchdowns. The Cowboys convert 51.0 percent of third downs and have scored touchdowns on 81.25 percent of red zone trips.

But this is the matchup that keeps a 0 and 4 team inside the number in four straight weeks. Tampa Bay's defense allows just 292.8 yards a game, and its run defense has been elite: opponents average minus 0.253 EPA on runs and 78.5 rushing yards a game. If Dallas wants to win big, it'll have to do it through the air against a secondary missing two starters.

Advanced Stats & Style Profile

Tampa Bay Buccaneers

Points per game / allowed19.0 / 24.0
Yards per game / allowed296.8 / 292.8
Yards per play (offense)5.0
Offensive EPA per play-0.159 (32nd)
Offensive success rate38.9% (27th)
Defensive EPA per play-0.066 (5th)
Defensive success rate allowed40.4% (6th)
Third down conversions19 of 55 (34.5%)
Turnover margin-5 (4 takeaways, 9 giveaways)

Dallas Cowboys

Points per game / allowed30.5 / 28.0
Yards per game / allowed355.8 / 392.8
Yards per play (offense)5.7
Offensive EPA per play+0.199 (2nd)
Offensive success rate49.1% (4th)
Defensive EPA per play+0.191 (31st)
Defensive success rate allowed51.6% (31st)
Third down conversions25 of 49 (51.0%)
Turnover margin0 (2 takeaways, 2 giveaways)

This is about as mirrored as an efficiency matchup gets. Dallas has the 2nd best offense by EPA per play and the 31st ranked defense. Tampa Bay has the 32nd ranked offense and the 5th best defense. Opponents are averaging plus 0.412 EPA when they throw against Dallas, which is the kind of number that usually belongs to a team giving up 30 a week. The Cowboys have also forced only 2 turnovers in four games.

On the other side, the Bucs' defensive numbers are why their losses have been so tight. They hold opponents to a 40.4 percent success rate, and nobody has run on them. The problem is everything the offense gives back: 16 sacks, 9 giveaways, a 34.5 percent third down rate and a red zone touchdown rate of 41.67 percent. Tampa Bay keeps getting into scoring range and kicking field goals.

Keys To The Game

Buccaneers Keys
Protect Daniels. 16 sacks allowed in four games, and Daniels took 3 on 33 dropbacks Sunday.
Lean on Irving. Dallas allows 150.3 rushing yards a game and is without Overshown. Shorter third downs mean fewer chances for turnovers.
Finish drives. A 41.67 percent red zone touchdown rate turned four winnable games into losses.
Cowboys Keys
Throw it to Lamb. Dallas passes are at plus 0.323 EPA, runs are at minus 0.058, and Tampa Bay is missing Winfield and Morrison.
Make Daniels beat them. A backup who threw 2 interceptions Sunday is the best chance for a defense with 2 takeaways all year to change that.
Avoid the shootout script. Three straight Dallas games have gone over 50 points. A loose game keeps the dog alive.

Market Context

This is a huge move for a regular season line. DraftKings, as shown in ESPN's odds feed, opened Dallas -3.5 at -110 on both sides. At 3:39 PM PT it's Dallas -9.5 at -108 and Tampa Bay +9.5 at -112. That's a six point move, straight through the key numbers of 4, 6 and 7, and almost all of it is the Mayfield news.

The moneyline tells the same story. Dallas opened at -205 and Tampa Bay at +170. Now it's -520 and +390, which implies 83.9 percent for the Cowboys before the vig comes out. ESPN's matchup predictor is even more bullish at 86.1 percent for Dallas. Bovada at the same minute is slightly off the DraftKings number at Dallas -9.5 (-105), Tampa Bay +9.5 (-115) and a moneyline of -480 and +350.

The total went the other way. DraftKings opened at 52.5 and is down to 48.5, with the over at -118 and the under at -102, while Bovada sits at 49. The market is betting that a backup quarterback drags the scoring down, even though three of Dallas's four games have cleared 50.

Final Thoughts

The case for Dallas is easy to make. Elite offense, home field, and a winless opponent starting a backup with a short week to prepare. If Prescott and Lamb do to this secondary what they've done to everybody else, the Cowboys can win this one going away.

The case for Tampa Bay is in the efficiency table. A top five defense that has kept all four games within one score, against a Dallas defense that ranks 31st and almost never takes the ball away. The Bucs' offense was already bad with Mayfield, so the question is how much worse it really gets with Daniels. The market says a lot. Thursday night will tell us whether that six point move was a correction or an overcorrection.

This page is analysis only and carries no pick. Every BetLegend play is posted separately before kickoff and graded when the game goes final at trustmyrecord.com.

Where Every Number Came From

Verification note (October 8, 2026, read between 3:38 and 3:40 PM PT). Kickoff, venue, Prime Video, records, home and road splits, NFC South and NFC East standings, team leaders, the injury report, per game team stats, the DraftKings open and current lines and the matchup predictor come from ESPN's game summary and scoreboard for event 401872980. Game scores come from ESPN's 2026 team schedules for Tampa Bay and Dallas. The depth chart order (Mayfield, Daniels, Stick) is ESPN's Buccaneers depth chart. Third down, turnover, sack and red zone numbers come from ESPN's 2026 team statistics feed. Yards per play is ESPN total yards divided by ESPN offensive plays (1,187 on 239 for Tampa Bay, 1,423 on 250 for Dallas). EPA per play, success rate and the Daniels and Mayfield passing splits are calculated from the nflverse 2026 play by play file (Weeks 1 through 4, all 64 games, pass and rush plays), with ranks out of 32. Bovada lines were read from Bovada's NFL game lines feed at 3:39 PM PT. Implied probabilities are math on the DraftKings moneyline. Lines move; check your book before kickoff.

Frequently Asked Questions

What time is Buccaneers vs Cowboys on October 8, 2026?
Thursday, October 8, 2026 at 5:15 PM Pacific (8:15 PM Eastern) at AT&T Stadium in Arlington, Texas, streaming on Prime Video. It is the Week 5 Thursday Night Football game.
What are the betting odds for Buccaneers vs Cowboys?
At DraftKings (via ESPN, read 3:39 PM PT) Dallas is -9.5 at -108 with Tampa Bay +9.5 at -112, the moneyline is Dallas -520 and Tampa Bay +390, and the total is 48.5. The line opened Dallas -3.5 with a total of 52.5. Bovada has Dallas -9.5 at -105, Tampa Bay +9.5 at -115 and a total of 49.
Is Baker Mayfield playing against the Cowboys?
No. ESPN lists Baker Mayfield as out with a dislocated thumb. Jalon Daniels is next on the Buccaneers depth chart. Daniels went 19 of 30 for 148 yards with 1 touchdown and 2 interceptions against Green Bay on Sunday.
What are the Buccaneers and Cowboys records?
Tampa Bay is 0 and 4, with losses of 33 to 27 at Cincinnati, 23 to 19 to Cleveland, 23 to 16 to Minnesota and 17 to 14 to Green Bay. Dallas is 2 and 2: a 28 to 20 loss at the Giants, a 37 to 20 win over Washington, a 34 to 31 loss to Baltimore and a 34 to 30 win at Houston.
Who are the key players to watch?
For Dallas: Dak Prescott (1,065 passing yards, 8 touchdowns, 1 interception), CeeDee Lamb (37 catches, 498 yards, 4 touchdowns) and Javonte Williams (231 rushing yards, 5 touchdowns). For Tampa Bay: Jalon Daniels at quarterback, Bucky Irving (241 rushing yards on 56 carries), Cade Otton (15 catches, 157 yards) and David Walker (2 sacks).
Who else is injured for Buccaneers vs Cowboys?
Per the ESPN injury report, Tampa Bay also has safety Antoine Winfield Jr., cornerback Benjamin Morrison and linebacker SirVocea Dennis out, with receiver Jalen McMillan on injured reserve. Dallas has tackle Drew Shelton, cornerback Cobie Durant and linebacker DeMarvion Overshown out, with guard Tyler Smith and receiver Jonathan Mingo questionable.

Link to this breakdown

MLB | Wednesday, October 7

Dodgers vs Braves NLDS Game 4: Glasnow Tries To Close It Out Against A Mahle Who Has Been Nearly Untouchable Since Joining Atlanta

Los Angeles Dodgers at Atlanta Braves, National League Division Series Game 4, Featured Game of the Day

The Dodgers are one win from the NLCS after Yoshinobu Yamamoto struck out 10 Braves in a 3 to 1 win at Truist Park on Tuesday. Atlanta has to win this afternoon to send the series back to Los Angeles, and it hands the ball to Tyler Mahle, who has a 1.99 ERA in nine regular season starts since the Braves acquired him in August. The Dodgers counter with Tyler Glasnow, who strikes out everybody but has been far more hittable since he came back from a back injury. The 100 win Dodgers are a solid road favorite.

Los Angeles Dodgers starter Tyler Glasnow in a royal blue Dodgers top and cap, tossing a baseball into his glove on the field at Tokyo Dome, the right hander who starts NLDS Game 4 against the Braves
Tyler Glasnow on the field at Tokyo Dome before a Dodgers game in March 2025. He starts Game 4 at Truist Park | Photo: ウィ貴公子, CC BY-SA 4.0, via Wikimedia Commons

Los Angeles Dodgers Dodgers vs Braves Atlanta Braves

Wednesday, October 7, 2026 | 3:00 PM PT / 6:00 PM ET | Truist Park, Atlanta, GA | FS1
NLDS Game 4 | Dodgers lead 2, 1 | Dodgers 100, 62 (NL West champions) | Braves 94, 68 (NL East champions) | Braves won the season series 5, 1
Moneyline
LAD -155 / ATL +128
Run Line
LAD -1.5 (+114) / ATL +1.5 (-137)
Total
7.5 (o -114 / u -106)
Implied Probability
LAD 60.8% / ATL 43.9%
Lines: DraftKings via ESPN, read 11:09 AM PT October 7. Opened LAD -135 / ATL +112, run line LAD -1.5 at +139, total 7 (o -120 / u -101).

Matchup Context

Los Angeles won the National League West at 100 and 62, with the best run differential of any team in this series by a mile, +201. The Dodgers scored 801 runs and allowed 600, they were nearly as good on the road (49 and 32) as at home (51 and 30), and they closed the regular season 8 and 2 in their last ten. They had a bye through the Wild Card round.

Atlanta won the National League East at 94 and 68 with a +116 run differential, 742 scored and 626 allowed. The Braves are a different team at Truist Park, 52 and 29 at home against 42 and 39 on the road. They finished the regular season 5 and 5 over their last ten, then had to grind through a three game Wild Card Series against Philadelphia at home: a 5 to 3 win on September 29, a 4 to 3 loss on September 30, and a 6 to 2 win on October 1 to advance.

The division series has been tight and low scoring. The Dodgers won Game 1 at Dodger Stadium 5 to 3 behind six innings of one run ball from Tarik Skubal. Atlanta stole Game 2 by a 3 to 2 score in Los Angeles, with Dylan Lee getting the win and Raisel Iglesias the save after Blake Snell walked five in 3.2 innings. Then on Tuesday at Truist Park, Yamamoto went seven innings, allowed one run on four hits and struck out 10, and the Dodgers beat Chris Sale 3 to 1. Across three games Los Angeles has scored 10 runs and Atlanta 7.

Here's what makes this matchup awkward for the favorite. Atlanta owned Los Angeles during the regular season, winning the series 5 games to 1 and outscoring the Dodgers 26 to 15. The three games at Truist Park in late August were all one run Braves wins, 4 to 3, 6 to 5 and 1 to 0, and Glasnow started the first of them. If Atlanta wins today, Game 5 is Friday at 5:00 PM Pacific at Dodger Stadium.

Injury Report & Lineup Notes

Los Angeles Dodgers
Graterol, Casparius, Cousins, Klein (RP) OUT
Brusdar Graterol (back surgery), Ben Casparius (shoulder), Jake Cousins (elbow surgery) and Will Klein (elbow), all on the 60 day injured list per ESPN.
Stone (SP) OUT
Gavin Stone, shoulder, 60 day injured list.
Starting
Tyler Glasnow (RHP), confirmed as the probable by MLB and ESPN. Last pitched September 24.
Atlanta Braves
Strider (SP) OUT
Spencer Strider, elbow, 60 day injured list.
Pérez, Elder (SP) OUT
Martín Pérez (back) and Bryce Elder (knee surgery), both on the 15 day injured list, per ESPN's report updated October 2.
López, Jiménez (RP) OUT
Reynaldo López (shoulder, 15 day list) and Joe Jiménez (knee surgery, 60 day list).
Starting
Tyler Mahle (RHP), confirmed as the probable by MLB and ESPN. Last pitched September 30 in the Wild Card Series.

Neither lineup is missing a regular. The injury lists are all pitching, and Atlanta's is the one that shapes this series. With Strider, Pérez and Elder out, Dylan Dodd went only 3 innings to start Game 1 and Ray Kerr opened Game 2, so they have leaned on relievers a lot already. Iglesias, Lee, Brent Suter and Dodd all pitched on Tuesday. For the Dodgers, Tanner Scott and Edwin Díaz worked Tuesday, and Díaz also pitched in Game 2.

Glasnow vs Mahle

Tyler Glasnow

Glasnow's season comes in two pieces. He made seven starts before low back spasms put him on the injured list on May 8, and he was excellent in that stretch, a 2.72 ERA over 39.2 innings. He didn't return until August 25, and his first start back came at Truist Park against this Braves team: 5 innings, 6 hits, 3 earned runs and 7 strikeouts in a 4 to 3 Dodgers loss. Since the return he has made six starts with a 4.46 ERA over 34.1 innings.

The odd thing is that the underlying numbers since the return are still very good. In those six starts he struck out 49 and walked 12, allowed only 25 hits and 2 home runs, and carried a 1.08 WHIP. His last two outings were 10 and 11 strikeout games. For the full season he's at 3.53 ERA, 0.95 WHIP and 98 strikeouts in 74 innings, and opponents hit just .175 against him. Using MLB's 2026 league totals, his FIP works out to 2.73, nearly a run below his ERA. He's been better on the road, a 2.84 ERA, than at home, 4.25. The catch is length: he hasn't reached 100 pitches in any of his six starts since coming back.

Tyler Mahle

Mahle's full season line, 7 and 10 with a 3.99 ERA and 1.23 WHIP over 149 innings, undersells what Atlanta has gotten. San Francisco traded him to the Braves on August 2, and in nine starts since he has a 1.99 ERA and a 0.96 WHIP over 54.1 innings, with 48 strikeouts against only 9 walks. He gave up two earned runs or fewer in eight of those nine starts. The lone blowup came in his final regular season start, 5 earned runs in 5 innings against Cincinnati on September 24.

He bounced right back in the Wild Card Series, going 7 innings with 1 earned run and 6 strikeouts against the Phillies on September 30, although the Braves lost that game 4 to 3. He's had six days off since. His home and road split is extreme, a 2.74 ERA at home and 5.28 on the road, and his only look at the Dodgers this season came while he was still a Giant, 7 innings on 3 hits with no earned runs and 5 strikeouts on April 22. The concern with Mahle is the long ball: 20 home runs allowed in 149 innings, and his FIP of 3.99 matches his ERA almost exactly.

So this is a matchup of a power arm whose results have lagged his stuff since he came back against a strike thrower with a 1.99 ERA since the trade. Glasnow misses more bats. Mahle has been the more reliable run preventer for two months, and he's pitching in the park where he's been at his best.

Advanced Stats & Style Profile

Los Angeles Dodgers (2026)

Record100, 62
Run differential+201
Runs scored / allowed801 / 600
AVG / OBP / SLG.257 / .338 / .424
Team OPS.762
Home runs / walks / strikeouts204 / 628 / 1,267
Team ERA / WHIP3.55 / 1.14
Saves / blown saves46 / 23
Glasnow ERA / FIP / WHIP3.53 / 2.73 / 0.95

Atlanta Braves (2026)

Record94, 68
Run differential+116
Runs scored / allowed742 / 626
AVG / OBP / SLG.246 / .309 / .409
Team OPS.718
Home runs / walks / strikeouts204 / 465 / 1,310
Team ERA / WHIP3.63 / 1.24
Saves / blown saves49 / 20
Mahle ERA / FIP / WHIP3.99 / 3.99 / 1.23

The two offenses hit exactly the same number of home runs, 204 apiece. The difference is everything around the homers. Los Angeles walked 628 times to Atlanta's 465, which is how a .257 hitting team gets to a .338 on base percentage, and it's why the Dodgers outscored the Braves by 59 runs over the season with identical power. Atlanta's .309 on base percentage means a lot of its run scoring depends on the ball leaving the park.

The Dodgers' lineup leaders: Shohei Ohtani hit .275 with a .377 on base percentage, 30 home runs and an .889 OPS. Max Muncy posted an .838 OPS with 29 homers, Andy Pages .811 with 23 homers and 85 RBI, and Freddie Freeman hit .288 with a .792 OPS. For Atlanta, Matt Olson hit 41 home runs with 93 RBI and an .823 OPS, Drake Baldwin had an .817 OPS with 25 homers, Michael Harris II hit .294 with 26 homers and 87 RBI, and Ronald Acuña Jr. had a .796 OPS and 21 steals in 469 plate appearances.

The series numbers line up with that. Freeman is 4 for 11 with 2 home runs and 2 walks, Muncy has 2 homers in 8 at bats, and Kyle Tucker is 4 for 12 with a homer. On the Atlanta side, Harris is 4 for 13, Ozzie Albies and Sean Murphy have Atlanta's two home runs, and Olson is 2 for 12 with 5 strikeouts. On the mound, the two staffs finished the regular season close, a 3.55 ERA for Los Angeles and 3.63 for Atlanta, but the Dodgers' 1.14 WHIP was a real edge over Atlanta's 1.24. At the plate, FanGraphs has the Dodgers at a 111 wRC+ for the regular season and Atlanta at 97, where 100 is league average, so Los Angeles was about 14 points better once park and league are accounted for.

Keys To The Game

Dodgers Keys
Make Mahle work. He walked 9 hitters in nine Braves starts. A lineup that drew 628 walks has to run his pitch count up and get to a bullpen that has already carried a heavy load.
Glasnow keeps the ball down in the zone. He has allowed 2 home runs in six starts since returning. Atlanta's 204 homers are most of its offense.
Freeman and Muncy stay hot. Those two and Tucker have 5 of the Dodgers' 7 home runs in this series.
Braves Keys
Mahle gives them six plus. Seven of his nine Braves starts went at least 6 innings. That's the only way to protect a bullpen that used four relievers on Tuesday.
Olson wakes up. The 41 homer first baseman has 5 strikeouts in 12 at bats this series.
Use the home park. 52 and 29 at Truist Park, a three game August sweep of these Dodgers there, and a Mahle home ERA of 2.74.

Market Context

DraftKings, as shown in ESPN's odds feed at 11:09 AM Pacific, has Los Angeles -155 and Atlanta +128. The moneyline opened Dodgers -135 and Braves +112, so the price has moved toward the road favorite, a shift worth roughly three and a half points of implied probability. At -155 the Dodgers are implied at 60.8 percent before the vig comes out.

The run line moved with it. Dodgers -1.5 opened at +139 and now sits at +114, with the Braves +1.5 down from -168 to -137. The total went the other way from what you might expect with Mahle's recent form: it opened at 7, with the over -120, and has been bumped to 7.5, now over -114 and under -106. So the market is leaning Dodgers and a little more scoring than it first expected, even with Glasnow's 0.95 season WHIP and Mahle's 0.96 since the trade. These are early afternoon East Coast prices, and playoff numbers can still move when lineups post, so check them again before first pitch.

Final Thoughts

On paper, Los Angeles has the deeper, more patient lineup, the better run differential and the momentum of a series lead built on two dominant starts from Skubal and Yamamoto. Atlanta has the regular season edge in this matchup, a home park where it played at a 104 win pace, and a starter who has allowed 12 earned runs in 54.1 innings since he got there.

The cleanest way to read it: if Glasnow's strikeout numbers since his return finally turn into the results his FIP says he deserves, the Dodgers' lineup only needs a couple of swings to end this. If he gives up the kind of crooked inning that inflated his ERA in September, Mahle has shown since August that he can sit on a small lead, and the series goes back to Los Angeles for a Game 5 on Friday.

This page is analysis only and carries no pick. Every BetLegend play is posted separately before the game and graded when it goes final at trustmyrecord.com.

Where Every Number Came From

Verification note (October 7, 2026, read between 11:07 and 11:20 AM PT). First pitch time, venue, FS1, records, home and road records, probable starters, the series score and ESPN's injury list come from ESPN's MLB scoreboard and game summary for event 401908016. The DraftKings open and current moneyline, run line and total come from ESPN's odds feed for the same event, read at 11:09 AM PT. Probable starters, broadcast and the Game 5 time were confirmed against MLB's schedule feed (game 849822 and the NLDS schedule). Standings, run differential, last ten records and home and road splits come from MLB's 2026 regular season standings. Team batting and pitching lines come from MLB's team season stats; player batting lines from MLB's active roster stats. Glasnow's and Mahle's season lines, game logs, home and road splits and Mahle's Wild Card start come from MLB's pitcher stats feeds; Mahle's trade date and Glasnow's injured list dates come from MLB's transaction log. Series results and series batting and pitching lines come from MLB's box scores for games 849828, 849823 and 849819. The regular season series comes from MLB's 2026 schedule for these two teams. FIP is calculated as (13 x HR + 3 x (BB + HBP), less 2 x K) divided by innings, plus a league constant of 3.09 derived from MLB's 2026 league pitching totals. Team wRC+ (111 for Los Angeles, 97 for Atlanta) comes from FanGraphs' 2026 team batting pages for both clubs, read at 4:25 PM PT after FanGraphs blocked our earlier request; the plate appearances, home runs, steals, on base and slugging on those pages match MLB's regular season team totals exactly.

Frequently Asked Questions

What time is Dodgers vs Braves NLDS Game 4 on October 7, 2026?
Wednesday, October 7, 2026 at 3:00 PM Pacific (6:00 PM Eastern) at Truist Park in Atlanta, on FS1.
What are the betting odds for Dodgers vs Braves Game 4?
At DraftKings via ESPN, read 11:09 AM Pacific on October 7: Dodgers -155 and Braves +128 on the moneyline, Dodgers -1.5 at +114 and Braves +1.5 at -137 on the run line, and a total of 7.5 with the over -114 and the under -106. The Dodgers opened -135 and the total opened at 7.
What is the series score between the Dodgers and Braves?
The Dodgers lead 2 games to 1. They won Game 1 5 to 3 and Game 3 3 to 1, and Atlanta won Game 2 3 to 2. A Game 5, if needed, is Friday, October 9 at 5:00 PM Pacific at Dodger Stadium.
Who are the starting pitchers for Dodgers vs Braves Game 4?
Tyler Glasnow for Los Angeles (5 and 2, 3.53 ERA, 0.95 WHIP, 98 strikeouts in 74 innings) and Tyler Mahle for Atlanta (7 and 10, 3.99 ERA overall, 1.99 ERA in nine starts with the Braves).
Who are the key players to watch?
For the Dodgers, Freddie Freeman (4 for 11 with 2 home runs in the series), Max Muncy (2 home runs), Kyle Tucker and Shohei Ohtani (.889 regular season OPS). For the Braves, Matt Olson (41 regular season home runs), Michael Harris II (4 for 13 in the series), Drake Baldwin and Ronald Acuña Jr.
How did the Braves and Dodgers do against each other in the 2026 regular season?
Atlanta won the season series 5 games to 1 and outscored Los Angeles 26 to 15, including a three game sweep at Truist Park on August 25 through 27.

Link to this breakdown

NFL | Sunday, October 4

Lions vs Panthers on Sunday Night Football: Jahmyr Gibbs Gets A Run Defense Allowing 193 Yards A Game, And Bryce Young Gets A Lions Secondary Without Brian Branch

Detroit Lions at Carolina Panthers, Week 4 Sunday Night Football, Featured Game of the Day

Three weeks in, Detroit and Carolina look like mirror images with the strengths swapped. The Lions run the ball well and can't stop the pass, giving up 326.3 passing yards a game. The Panthers throw it all over the field and can't stop the run, giving up 193.3 rushing yards a game. That's the whole story of Sunday night in Charlotte, and the betting market has noticed: the total opened 45.5 at DraftKings and it's 51.5 now.

Detroit Lions quarterback Jared Goff, number 16 in the blue Lions home uniform, signaling first down at Ford Field, the quarterback who leads Detroit into Carolina on Sunday Night Football
Jared Goff signals a first down at Ford Field. He takes 8 touchdown passes and no interceptions into Sunday night in Charlotte | Photo: All Pro Reels, CC BY SA 2.0, via Wikimedia Commons

Detroit Lions Lions vs Panthers Carolina Panthers

Sunday, October 4, 2026 | 5:20 PM PT / 8:20 PM ET | Bank of America Stadium, Charlotte, NC | NBC
Week 4 Sunday Night Football | Lions 2, 1 (2, 0 home, 0, 1 road) | Panthers 1, 2 (0, 1 home, 1, 1 road)
Moneyline
DET -192 / CAR +160
Spread
DET -3.5 (-115) / CAR +3.5 (-105)
Total
51.5 (o -102 / u -118)
Implied Probability
DET 65.8% / CAR 38.5%
Lines: DraftKings via ESPN, read 4:32 AM PT October 4. Opened DET -3 / CAR +3, DET -162 / CAR +136, total 45.5.

Matchup Context

Detroit is 2 and 1, and every one of its games has turned into a shootout. The Lions beat New Orleans 31 to 30 at Ford Field in Week 1, lost 41 to 31 in Buffalo in Week 2, and beat the Jets 31 to 24 at home last Sunday. That's 31 points in all three games, and 95 points allowed across the three. Their games have produced 61, 72 and 55 total points.

Carolina is 1 and 2 and has been all over the map. The Panthers opened by losing 59 to 37 at home to Chicago, then went to Atlanta and won 34 to 3, then lost 21 to 18 in Cleveland. So the same team has played a 96 point game and two games in the 30s. Sunday night is only Carolina's second home game, and the first one ended with Chicago scoring 59.

This is Detroit's second road game. The first was the loss in Buffalo, where the defense gave up 41. The Lions still have the cleaner résumé: Jared Goff hasn't thrown an interception, Detroit has scored on every red zone trip, and ESPN's matchup predictor makes the Lions a 61 percent favorite.

Injury Report & Lineup Notes

Detroit Lions
Status
Branch (S) OUT Bartch (G) OUT Reed (CB) Questionable
Injured Reserve
C Cade Mays (wrist), S Thomas Harper (ankle)
Questionable
CB D.J. Reed (ribs), who also leads the Lions with 24 tackles. Branch is out with an Achilles injury and Bartch with a foot injury.
Carolina Panthers
Status
Lewis (G) OUT Coker (WR) Questionable Jackson, Hunter (DT) Questionable
Injured Reserve
WR Xavier Legette (knee)
Questionable
WR Jalen Coker (quadriceps), DT Cam Jackson (knee), DT Lee Hunter (foot). Lewis is out with an elbow injury.

The injury that matters most sits in the Detroit secondary. With Brian Branch out and Thomas Harper on injured reserve, the Lions are down two safeties against a passing offense averaging 313 yards a game, and cornerback D.J. Reed, the team's leading tackler, is questionable with a rib injury. On the other side, Carolina's two questionable defensive tackles, Cam Jackson and Lee Hunter, are the exact bodies a defense allowing 193.3 rushing yards a game can least afford to lose. And Jalen Coker, Carolina's leading receiver with 222 yards and 2 touchdowns, is questionable with a quad injury. His status could be the biggest single swing in this game.

Both offensive lines are patched too. Detroit is missing guard Ben Bartch and center Cade Mays; Carolina is without guard Damien Lewis.

Strength Against Weakness, Both Ways

When Detroit has the ball

Goff is 77 of 109 for 802 yards, 8 touchdowns and no interceptions. That's a 70.6 percent completion rate and a 116.1 passer rating. Amon Ra St. Brown has 23 catches for 228 yards and 5 touchdowns. But the Carolina matchup points somewhere else. The Panthers allow only 186 passing yards a game, and they give up 193.3 on the ground. That's where Jahmyr Gibbs comes in. He has 307 yards and 4 touchdowns on 65 carries, about 4.7 a carry, and Detroit runs for 120.7 yards a game as a team at 4.4 a carry. If the Lions lean on Gibbs early, they also protect a defense that needs rest, and they already hold the ball longer, about 31 and a half minutes a game.

When Carolina has the ball

Bryce Young is 72 of 121 for 939 yards, 7 touchdowns and 2 interceptions, and Carolina throws for 313 yards a game at 7.7 yards an attempt. Young's 59.5 percent completion rate says it hasn't been efficient so much as explosive. Now he gets a Lions defense allowing 326.3 passing yards and 443.7 total yards a game, missing Branch and maybe Reed. The counter is Aidan Hutchinson, who has 3.5 of Detroit's 12 sacks. Carolina has allowed 7 sacks, and its third down rate is only 36.8 percent. If Hutchinson wins early, the Panthers' passing game turns into the stop and start version that lost in Cleveland. Chuba Hubbard, with 184 yards on 41 carries, gives Carolina a way to stay ahead of the chains.

Advanced Stats & Style Profile

Detroit Lions (2026)

Record2, 1
Points for / against per game31.0 / 31.7
Yards per game / allowed388.0 / 443.7
Yards per play5.8
Pass yards allowed per game326.3
Rush yards allowed per game117.3
Third down conversion41.2%
Red zone scoring100%
Turnover margin+3 (4 takeaways, 1 giveaway)
Sacks / sacks allowed12 / 7

Carolina Panthers (2026)

Record1, 2
Points for / against per game29.7 / 27.7
Yards per game / allowed410.0 / 379.3
Yards per play6.3
Pass yards allowed per game186.0
Rush yards allowed per game193.3
Third down conversion36.8%
Red zone scoring92.3%
Turnover margin+3 (7 takeaways, 4 giveaways)
Sacks / sacks allowed7 / 7

Carolina actually gains more per snap, 6.3 yards a play to Detroit's 5.8, and outgains the Lions per game, 410 to 388. The gap is in finishing drives and in ball security. Detroit has given the ball away once in three games. Carolina has given it away four times, but it has also taken it away seven times, and the Panthers held Atlanta to 3 points in Week 2. Both defenses are giving up chunks: Detroit through the air, Carolina on the ground.

EPA and success rate figures were not available from a source that could be verified this morning, so this breakdown uses yards per play, which ESPN's team totals support directly.

Keys To The Game

Lions Keys
Feed Gibbs. A defense giving up 193.3 rushing yards a game is a soft matchup for a back averaging about 4.7 a carry.
Hutchinson in the backfield. His 3.5 sacks are the Lions' best answer to a passing game averaging 7.7 yards an attempt.
Keep the clean sheet. No interceptions from Goff in three games. Carolina has 3 picks and 7 takeaways.
Panthers Keys
Attack the safeties. With Branch out and Harper on injured reserve, the middle of the Detroit secondary is the softest spot on the field.
Coker's status. 222 yards and 2 touchdowns, and with Xavier Legette on injured reserve there isn't another receiver with that production.
Win third down. 36.8 percent won't keep Goff on the sideline, and Detroit converts 41.2 percent of its own.

Market Context

The biggest move is on the total. DraftKings opened it at 45.5 and it's 51.5 now, a six point climb, with the over at -102 and the under at -118. That's the market pricing in what the yardage numbers say: two defenses that have each allowed 27 or more points a game. Detroit's three games have averaged 62.7 total points, and Carolina's have averaged 57.3, though that number leans hard on the 96 point opener.

The side has moved toward Detroit as well. The Lions opened -3 and -162, and they're -3.5 and -192 now, with the -3.5 priced at -115. At -192 the moneyline implies about a 65.8 percent chance, a few points higher than ESPN's 61 percent predictor. ESPN's forecast for kickoff in Charlotte is 66 degrees with a 60 percent chance of rain and light wind.

Final Thoughts

This is a game where each team's best unit meets the other's worst. If Gibbs runs the way the numbers suggest, Detroit can control the clock and keep Young on the sideline. If Young finds the holes in a secondary missing Branch, Carolina can keep pace the way it did in a 37 point night against Chicago. The market has already decided it expects points and a Detroit edge. The questions left before kickoff are Coker's quad and Reed's ribs, and the inactive list about 90 minutes before the 5:20 PM Pacific kickoff will settle both.

Where Every Number Came From

Verification note (October 4, 2026, read between 4:20 and 4:35 AM PT). Kickoff time, venue, NBC, overall, home and road records, ESPN's matchup predictor, the injury list with statuses, season leaders (Goff, Young, Gibbs, Hubbard, St. Brown, Coker, Hutchinson, Reed) and the kickoff weather forecast come from ESPN's NFL scoreboard and game summary for event 401872978. The DraftKings open and current spread, moneyline and total come from ESPN's odds feed for the same event, read at 4:32 AM PT. Game by game scores for Weeks 1 to 3 come from ESPN's 2026 team schedules for Detroit and Carolina. Points, yards, passing and rushing yards for and against per game, completion rate, passer rating, yards per attempt and carry, third and fourth down rates, red zone scoring, takeaways, giveaways, sacks and possession time come from ESPN's 2026 regular season team statistics. Yards per play is calculated by BetLegend as total yards divided by offensive plays (Detroit 1,164 on 199, Carolina 1,230 on 196). Average total points per game are calculated from the scores above. Implied probabilities are calculated from the posted moneylines. EPA and success rate were not available from a verifiable source this morning and are omitted.

Frequently Asked Questions

What time is Lions vs Panthers on October 4, 2026?
Sunday, October 4, 2026 at 5:20 PM Pacific (8:20 PM Eastern) at Bank of America Stadium in Charlotte, North Carolina, on NBC's Sunday Night Football.
What are the betting odds for Lions vs Panthers?
At DraftKings via ESPN, read 4:32 AM Pacific on October 4: Lions -3.5 at -115 and Panthers +3.5 at -105, Lions -192 and Panthers +160 on the moneyline, and a total of 51.5 with the over -102 and the under -118. The Lions opened -3 and the total opened 45.5.
What are the Lions' and Panthers' records?
Detroit is 2 and 1 (wins over New Orleans and the Jets, a loss at Buffalo). Carolina is 1 and 2 (a win at Atlanta, losses to Chicago and at Cleveland).
Who is injured for Lions vs Panthers?
Detroit safety Brian Branch and guard Ben Bartch are out, and cornerback D.J. Reed is questionable. Carolina guard Damien Lewis is out, and receiver Jalen Coker and defensive tackles Cam Jackson and Lee Hunter are questionable.
Who are the key players to watch?
Jared Goff (802 yards, 8 touchdowns, no interceptions), Jahmyr Gibbs (307 rushing yards, 4 touchdowns), Amon Ra St. Brown (5 touchdown catches) and Aidan Hutchinson (3.5 sacks) for Detroit; Bryce Young (939 yards, 7 touchdowns), Jalen Coker (222 receiving yards) and Chuba Hubbard (184 rushing yards) for Carolina.
Where is the game played?
Bank of America Stadium in Charlotte, North Carolina. It's Carolina's second home game; the Panthers lost the first 59 to 37 to Chicago.

Link to this breakdown

MLB | Saturday, October 3

Yankees vs Rays ALDS Game 1: Cole And Rasmussen Run It Back, And Aaron Judge Is On The Injured List

New York Yankees at Tampa Bay Rays, American League Division Series Game 1, Featured Game of the Day

Less than two weeks ago these two starters faced these two lineups in the Bronx and both of them won. Drew Rasmussen struck out 11 Yankees over 6.2 innings on September 22, and Gerrit Cole struck out 8 Rays the next night. Now they open a division series at Tropicana Field, with the 98 win Rays a modest home favorite and the Yankees arriving off a two game Wild Card sweep of Boston that they pulled off without Aaron Judge.

Tampa Bay Rays starter Drew Rasmussen, in the white Rays home uniform, driving toward the plate during a June 2026 game, the right hander who starts ALDS Game 1 against the Yankees
Drew Rasmussen delivers during a June 2026 Rays game. He gets the ball in Game 1 against the Yankees | Photo: Raysfanjake1984, CC0, via Wikimedia Commons

New York Yankees Yankees vs Rays Tampa Bay Rays

Saturday, October 3, 2026 | 3:30 PM PT / 6:30 PM ET | Tropicana Field, St. Petersburg, FL | TBS, truTV
ALDS Game 1 | Rays 98, 64 (AL East champions) | Yankees 93, 68, swept Boston 2, 0 in the Wild Card Series | Rays won the season series 7, 6
Moneyline
NYY +113 / TB -137
Run Line
NYY +1.5 (-199) / TB -1.5 (+163)
Total
7 (o -107 / u -113)
Implied Probability
TB 57.8% / NYY 46.9%
Lines: DraftKings via ESPN, read 1:58 AM PT October 3. Opened TB -133 / NYY +110, run line TB -1.5 at +167, total 7 at -110 both ways.

Matchup Context

Tampa Bay won the American League East at 98 and 64, four and a half games clear of New York, and it did a lot of that damage at home. The Rays went 55 and 26 at Tropicana Field. The Yankees finished 93 and 68 and were actually better away from home than in the Bronx, 47 and 34 on the road against 46 and 34 at Yankee Stadium.

Here's the part the standings hide. New York finished with a run differential of +138. Tampa Bay finished at +86. The Yankees scored 739 runs and allowed 601; the Rays scored 736 and allowed 650. So the two offenses produced almost the same number of runs over a full season, and the gap was on the run prevention side, in New York's favor.

The two teams also limped into the final week the same way, 5 and 5 over their last ten regular season games. What happened after that is different. The Rays have not played since their regular season finale on September 27, a loss in Philadelphia. The Yankees beat Boston 9 to 0 and 9 to 2 at Yankee Stadium on September 29 and 30, with Cam Schlittler and Max Fried starting those games, which is why Cole lines up for Game 1 on full rest.

The season series could not have been much tighter. Tampa Bay won it 7 games to 6, but New York outscored the Rays 54 to 45 across those 13 games. The Rays took 5 of 7 at Tropicana Field, including a three game sweep in April by scores of 5 to 3, 5 to 4 and 5 to 4. New York took 4 of 6 in the Bronx, including 9 to 2 and 6 to 4 in the last two meetings on September 23 and 24.

Injury Report & Lineup Notes

New York Yankees
Judge (RF) OUT, 10 Day IL
Aaron Judge, calf, per ESPN's injury report updated October 2. He is not on the Yankees active roster in MLB's roster feed for October 3 and did not play in either Wild Card game.
Weathers, Schmidt (SP) OUT
Ryan Weathers, forearm, and Clarke Schmidt, biceps, both on the 15 day injured list.
Cruz, Castro (RP) OUT
Fernando Cruz and Kervin Castro, both elbow, both on the 60 day injured list.
Back in the mix
Giancarlo Stanton was activated from the 60 day injured list and Trent Grisham from the 10 day list on September 29. Grisham batted third in the Wild Card opener.
Starting
Gerrit Cole (RHP), confirmed as the probable by MLB and ESPN.
Tampa Bay Rays
McClanahan (SP) OUT
Shane McClanahan, forearm. He was activated from the 15 day list on September 28, but ESPN's report updated October 2 lists him out.
Jax (P) Day To Day
Griffin Jax, back.
Lux, Uceta, Heasley OUT
Gavin Lux (shoulder), Edwin Uceta (shoulder) and Jonathan Heasley (elbow), all on the 60 day injured list.
Starting
Drew Rasmussen (RHP), confirmed as the probable by MLB and ESPN.

Judge is the headline, but look at what the Yankees did without him. Two Wild Card games, 18 runs, and a lineup built around Ben Rice, Cody Bellinger, Luis García Jr. and Paul Goldschmidt. Judge only logged 285 plate appearances this season, with an .871 OPS and 18 home runs, so New York has spent a lot of 2026 playing without him already. Rice has been the engine: 41 home runs, 97 RBI and an .897 OPS over 667 plate appearances.

For Tampa Bay, McClanahan's status matters more for the shape of the series than for tonight. He beat the Yankees on July 8, and losing him thins the rotation behind Rasmussen. Jax being day to day with a back issue is the one to watch for Game 1 itself, since it could narrow Tampa Bay's pitching options.

Cole vs Rasmussen, Round Three

Drew Rasmussen

Rasmussen had the better season by just about every measure. He went 16 and 5 over 30 starts with a 2.67 ERA, a 0.91 WHIP and 174 strikeouts against 32 walks in 172 innings. He allowed only 14 home runs, and opponents hit .199 against him. Using MLB's 2026 league totals, his FIP works out to 2.81, so the ERA isn't a mirage built on luck with balls in play. He was slightly better on the road (2.47) than at home (2.87), but both are excellent.

He's also on a run. Over his last six starts he allowed 6 earned runs in 37.2 innings and won all six. The last of those was the gem in the Bronx, 6.2 innings, 1 hit, 1 run and 11 strikeouts. Against the Yankees this season he made four starts and gave up 7 earned runs in 22 innings. Three of those starts were dominant, and one was a disaster: on July 9 New York knocked him out after 2.1 innings with 6 earned runs on 7 hits in a 12 to 4 win. That's the version of this game the Yankees are hoping for.

Gerrit Cole

Cole didn't make his first start until May 22, and he finished with 22 starts, a 10 and 9 record, a 3.61 ERA and a 1.10 WHIP over 127 innings. The strikeout and walk numbers are still elite, 131 strikeouts against 25 walks, but he gave up 22 home runs, and that pushes his FIP up to 3.92. Interestingly, he was better on the road (3.41 ERA) than at home (3.86).

Against the Rays, though, he has been very good. Three starts, 18 innings, 5 earned runs, 16 strikeouts and 1 home run allowed. He threw six scoreless innings against them at Yankee Stadium in his season debut on May 22, took a 3 to 0 loss at Tropicana Field on July 8 when the Yankees didn't score for him, and then beat the Rays on September 23 with 5.2 innings, 2 runs and 8 strikeouts. His recent form is less tidy than Rasmussen's: across his last six starts he went 34.1 innings and allowed 19 earned runs, including 5 in 4.1 innings against the Mets on September 12.

So the starting matchup is a strikeout pitcher with a home run problem against a strikeout pitcher who barely gives up the long ball. The Yankees hit 223 home runs this season, 54 more than the Rays. If Rasmussen keeps the ball in the yard the way he has all year, New York has to manufacture runs against a lineup that is built to do exactly that.

Advanced Stats & Style Profile

New York Yankees (2026)

Record93, 68
Run differential+138
Runs scored / allowed739 / 601
AVG / OBP / SLG.235 / .311 / .409
Team OPS.720
Home runs / strikeouts223 / 1,480
Team ERA / WHIP3.23 / 1.17
Saves / blown saves45 / 28
Cole ERA / FIP / WHIP3.61 / 3.92 / 1.10

Tampa Bay Rays (2026)

Record98, 64
Run differential+86
Runs scored / allowed736 / 650
AVG / OBP / SLG.258 / .326 / .402
Team OPS.728
Home runs / strikeouts169 / 1,145
Team ERA / WHIP3.70 / 1.14
Saves / blown saves58 / 19
Rasmussen ERA / FIP / WHIP2.67 / 2.81 / 0.91

These are two offenses that got to the same place by very different roads. Tampa Bay hit .258 as a team and struck out only 1,145 times, 335 fewer than New York. The Yankees hit .235 but slugged their way to almost the same OPS, .720 to .728, on the back of 223 home runs. One team puts the ball in play and runs (the Rays stole 164 bases), the other waits for a mistake it can hit over the wall.

On the run prevention side, the Yankees' staff had the lower ERA, 3.23 to 3.70, and allowed 36 fewer home runs. The Rays' staff walked fewer hitters (409 to 488) and had the better WHIP. The bullpens tell a split story too. Tampa Bay converted 58 saves and blew only 19. New York saved 45 and blew 28, which is a number worth keeping in mind if Game 1 is close in the eighth inning.

The lineup leaders line up with those profiles. Junior Caminero led the Rays with 42 home runs, 101 RBI and an .884 OPS. Yandy Díaz hit .293, Liam Hicks .284 with a .367 on base percentage, and Chandler Simpson hit .306 with 46 steals. For New York, Rice, García Jr. (30 home runs, .830 OPS) and Bellinger (.767 OPS) carry the lineup with Judge out. Team wRC+ wasn't available from a source we could verify this morning, so it's left out rather than guessed.

Keys To The Game

Yankees Keys
Find the mistake pitch. Rasmussen allowed 14 home runs in 172 innings. The Yankees hit 223. The one start where they got to him, July 9, they scored 12.
Cole keeps it in the park. His 22 home runs allowed are the only real blemish on his line, and his three starts against the Rays included just one.
Win the late innings. A bullpen with 28 blown saves has to hold a lead in a road playoff game.
Rays Keys
Put the ball in play. Tampa Bay struck out 335 fewer times than New York. Against a pitcher who fanned 131 in 127 innings, contact and speed are the path.
Rasmussen goes deep. He averaged under 6 innings a start but went 6 or more in five of his last six. Every out he gets keeps a short bench of relievers fresh.
Lean on the dome. 55 and 26 at Tropicana Field, and 5 and 2 at home against New York this season.

Market Context

DraftKings, as shown in ESPN's odds feed at 1:58 AM Pacific, has Tampa Bay -137 and New York +113. The moneyline opened at Rays -133 and Yankees +110, so the overnight move has been small and toward the home side, less than one point of implied probability. At -137 the Rays are implied at 57.8 percent before the vig comes out.

The run line followed it by a hair. Rays -1.5 opened at +167 and sits at +163, with the Yankees +1.5 at -199. The total opened at 7 with -110 on both sides and is still 7, now with the under at -113 and the over at -107. A total of 7 with two starters carrying 9 plus strikeouts per nine innings is the market saying it expects the starters to control this one, and the slight shade to the under fits Rasmussen's season. These numbers are early morning prices, and playoff lines tend to move as lineups are posted, so check them again before first pitch.

Final Thoughts

On paper, Tampa Bay has the better starter tonight, the better home record and the more reliable bullpen, and the price reflects that. New York has the better run differential, the deeper power and a lineup coming off two lopsided Wild Card wins, even without Judge. The Rays, for their part, have had five days off since their last game.

The cleanest way to read it: if Rasmussen pitches like he did on September 22, the Rays' contact offense only needs a few runs. If he pitches like he did on July 9, the Yankees have already shown they can turn that into a crooked number in a hurry. Cole's job is simpler to describe and harder to do: limit the home run, and keep a pesky lineup from stringing singles together.

This page is analysis only and carries no pick. Every BetLegend play is posted separately before the game and graded when it goes final at trustmyrecord.com.

Where Every Number Came From

Verification note (October 3, 2026, read between 1:55 and 2:05 AM PT). First pitch time, venue, TBS and truTV, records, home and road records, probable starters, the season series summary and ESPN's injury list come from ESPN's MLB scoreboard and game summary for event 401907985. The DraftKings open and current moneyline, run line and total come from ESPN's odds feed for the same event, read at 1:58 AM PT. Probable starters were confirmed against MLB's schedule feed (game 849835). Standings, run differential, last ten records and division standing come from MLB's 2026 standings API. Team hitting and pitching totals, pitcher season lines, home and road splits and game logs come from MLB's stats API (regular season only). The 13 game season series results and scores come from MLB's 2026 schedule. Wild Card scores and lineups come from MLB's box scores for games 849851 and 849848. Transactions (Stanton, Grisham, McClanahan activations) come from MLB's transactions feed, and the active roster check is MLB's roster feed for October 3. FIP is calculated by BetLegend as (13 HR + 3 (BB + HBP) minus 2 K) divided by innings, plus a 3.093 constant derived from MLB's 2026 league totals across all 30 teams. Implied probabilities are calculated from the posted moneylines. Team wRC+ and expected stats were not available from a verifiable source this morning and are omitted.

Frequently Asked Questions

What time is Yankees vs Rays ALDS Game 1 on October 3, 2026?
Saturday, October 3, 2026 at 3:30 PM Pacific (6:30 PM Eastern) at Tropicana Field in St. Petersburg, Florida, on TBS and truTV.
What are the betting odds for Yankees vs Rays Game 1?
At DraftKings via ESPN, read 1:58 AM Pacific on October 3: Rays -137 and Yankees +113 on the moneyline, Rays -1.5 at +163 and Yankees +1.5 at -199 on the run line, and a total of 7 with the over -107 and the under -113. The Rays opened -133.
Who are the starting pitchers for Yankees vs Rays Game 1?
Gerrit Cole for New York (10 and 9, 3.61 ERA, 131 strikeouts in 127 innings) and Drew Rasmussen for Tampa Bay (16 and 5, 2.67 ERA, 174 strikeouts in 172 innings).
Is Aaron Judge playing in ALDS Game 1?
ESPN's injury report, updated October 2, lists Judge on the 10 day injured list with a calf injury, and he is not on the Yankees active roster in MLB's roster feed for October 3. He did not play in either Wild Card game against Boston.
Who won the Yankees vs Rays season series in 2026?
Tampa Bay won it 7 games to 6, going 5 and 2 at Tropicana Field. New York outscored the Rays 54 to 45 across the 13 games.
How did the Yankees reach the Division Series?
They swept Boston in the Wild Card Series at Yankee Stadium, 9 to 0 on September 29 and 9 to 2 on September 30. The Rays won the AL East at 98 and 64 and had not played since September 27.

Link to this breakdown

NHL | Friday, October 2

Blues vs Stars: Dallas Opens At Home With Last Season's Best Power Play Against A Kill That Leaked

St. Louis Blues at Dallas Stars, NHL Opening Night 2026 to 27, Featured Game of the Day

Opening night in Dallas puts a 112 point team against an 86 point team, and the gap between them last season showed up most clearly with somebody in the penalty box. The Stars converted 28.6 percent of their power plays. The Blues killed 76.7 percent of theirs. The market has Dallas a solid home favorite, though it has come down off the opening number, and the goaltending matchup is the reason it might not be as simple as last season's standings.

Dallas Stars players in green line up for a faceoff at center ice inside American Airlines Center, where the Stars host the St. Louis Blues on opening night
The Stars in their home greens taking a faceoff at American Airlines Center, where they open the 2026 to 27 season against St. Louis | Photo: Michael Barera, CC BY-SA 4.0, via Wikimedia Commons

St. Louis Blues Blues vs Stars Dallas Stars

Friday, October 2, 2026 | 6:00 PM PT / 9:00 PM ET | American Airlines Center, Dallas, TX | TNT, truTV
Season opener for both | Last season: Dallas 112 points, St. Louis 86 | Dallas won the series 3 to 1
Moneyline
STL +154 / DAL -185
Puck Line
STL +1.5 (-175) / DAL -1.5 (+145)
Total
5.5 (o -135 / u +114)
Implied Probability
DAL 64.9% / STL 39.4%
Lines: DraftKings via ESPN, read 9:16 AM PT October 2. Opened DAL -205 / STL +170, puck line DAL -1.5 at +120, over 5.5 at -120.

Matchup Context

Nobody has played a game yet, so everything we know about this matchup comes from last season and the offseason roster moves. Last season was not close. Dallas finished with 112 points, 50 wins, 20 regulation losses and 12 overtime losses, and a goal differential of +53. St. Louis finished with 86 points on 37 wins, 33 regulation losses and 12 overtime losses, and it was outscored by 27 over 82 games.

The Stars were also a very good home team. They went 26, 11 and 4 at American Airlines Center, while the Blues went 17, 19 and 5 on the road. Both clubs finished the season playing well, Dallas 7, 2 and 1 over its last ten and St. Louis 6, 3 and 1, so neither one limped into the summer.

The head to head leaned Dallas too. The Stars took 3 of 4 meetings, all four settled in regulation. St. Louis won the first one 3 to 1 at home on October 18, 2025. Dallas then won 3 to 2 at home in January, 4 to 3 in St. Louis four days later, and 5 to 4 at home on February 4. The last three were all one goal games, which is worth remembering before you assume the standings gap shows up on the scoreboard.

It's a Central Division game on the first night of the season, on national television. Both teams get a clean slate and an immediate measuring stick.

Injury Report & Lineup Notes

St. Louis Blues
Mailloux (D) OUT
Logan Mailloux, injured reserve, hand.
Tucker (D) OUT
Tyler Tucker, injured reserve, knee. Two of the Blues defensemen on ESPN's roster open on injured reserve.
Trudeau OUT
Felix Trudeau, injured reserve, undisclosed.
Expected in goal
Joel Hofer (ESPN probable).
New on the roster
Connor McMichael (46 points for Washington last season), Mason McTavish (41 points for Anaheim), Brandon Carlo and Justin Barron. Jordan Kyrou, fifth on the Blues in points last season with 46, is not on the current ESPN roster.
Dallas Stars
Duchene (C) OUT
Matt Duchene, injured reserve, lower body. He had 45 points in 57 games last season, fifth on the team.
Hughes OUT
Cameron Hughes, injured reserve, upper body.
Scott, Krys, Bertucci OUT
Harrison Scott, Luke Krys and Tristan Bertucci, injured reserve, undisclosed.
Expected in goal
Jake Oettinger (ESPN probable).

Duchene is the name that matters most. Dallas still has its top four scorers from last season, but losing a 45 point center thins out the middle six and the second power play unit. On the St. Louis side the bigger story is roster turnover rather than injuries: McMichael and McTavish combined for 87 points elsewhere last season and both arrive as new faces against a team they haven't faced in a Blues sweater.

Oettinger, Hofer And The Special Teams Gap

The goaltending

Here's the part of the matchup that runs against the standings. Joel Hofer was the better goalie on a per shot basis last season. He started 43 games, went 24 and 13, and stopped .910 of the shots he faced with a 2.61 goals against average and 6 shutouts. Jake Oettinger carried a bigger load, 54 starts and 35 wins against 12 losses, but his save percentage was .899 with a 2.59 goals against average and 4 shutouts.

Oettinger's goals against average was slightly lower because the team in front of him allowed fewer shots. Dallas gave up 26.2 shots a game; St. Louis gave up 27.7. Strip that out and Hofer had the better individual season, which is the main reason a team that finished 26 points behind can win a game like this.

The power play against the kill

This is where Dallas separated itself. The Stars' power play converted 28.6 percent of the time last season, and Robertson, Johnston and Rantanen each had at least 34 power play points. The Blues killed 76.7 percent of their penalties. Flip it around and St. Louis converted 17.6 percent with the extra man, against a Dallas kill that worked 80.3 percent of the time.

At five on five the two teams looked much more alike than the standings suggest. Both averaged 25.3 shots a game. Dallas won 51.6 percent of its faceoffs and St. Louis 49.4. The difference in goals, 3.33 a game for Dallas against 2.80 for St. Louis, leans heavily on what happened on special teams.

Advanced Stats & Style Profile

St. Louis Blues (2025 to 26)

Points / goal differential86 / -27
Goals for / against per game2.80 / 3.10
Shots for / against per game25.3 / 27.7
Power play17.6%
Penalty kill76.7%
Faceoff win rate49.4%
Road record17, 19, 5
Hofer save pct / GAA.910 / 2.61

Dallas Stars (2025 to 26)

Points / goal differential112 / +53
Goals for / against per game3.33 / 2.71
Shots for / against per game25.3 / 26.2
Power play28.6%
Penalty kill80.3%
Faceoff win rate51.6%
Home record26, 11, 4
Oettinger save pct / GAA.899 / 2.59

The profile is a Dallas team that doesn't outshoot people by much but converts more of its chances, especially with the man advantage, and keeps the puck out of its own net slightly better. St. Louis gave up more shots than it took and relied on Hofer to bail out a below average penalty kill. We could not read an expected goals share (xGF%) from a source we could verify this morning, so it is left off rather than guessed.

Scoring depth is another Dallas edge on paper. Robertson and Johnston both scored 45 goals, Robertson finished with 96 points, Johnston 86, Rantanen 77 in 64 games and Heiskanen 63 from the blue line. Robert Thomas led St. Louis with 64 points in 64 games, followed by Holloway and Snuggerud at 51 each.

Keys To The Game

Blues Keys
Stay out of the box. A 76.7 percent kill against a 28.6 percent power play is the worst matchup on the board for St. Louis. Five on five, these teams were even on shots.
Let Hofer steal it. His .910 last season was better than Oettinger's .899. A one goal game is the Blues' path, and three of last season's four meetings were one goal games.
Get the new forwards going. McMichael and McTavish add 87 points of last season's production to a lineup that needed scoring behind Thomas.
Stars Keys
Draw penalties. Robertson, Johnston and Rantanen each had at least 34 power play points. More power plays means more of Dallas's biggest advantage.
Cover for Duchene. A 45 point center is out, so the depth lines have to hold their own against a Blues lineup with new faces.
Keep the home edge. 26, 11 and 4 at American Airlines Center last season, and both of last season's meetings in Dallas went to the Stars.

Market Context

DraftKings, as shown in ESPN's odds feed at 9:16 AM Pacific, has Dallas -185 and St. Louis +154. Those numbers opened at Dallas -205 and St. Louis +170, so the price has moved toward the Blues by about two points of implied probability. At -185 the Stars are implied at 64.9 percent before the vig comes out, and the Blues at 39.4 percent.

The puck line moved the same way. Dallas -1.5 opened at +120 and now sits at +145, with St. Louis +1.5 at -175. The total is 5.5, but the over has been bet from -120 to -135 with the under now +114. So the market is leaning toward a little more scoring and a slightly closer game than the opening numbers said, which lines up with Hofer's season and the turnover in the Blues forward group.

Final Thoughts

On last season's evidence Dallas is the better team in nearly every way that matters: points, goal differential, home record, scoring depth and above all special teams. The one place St. Louis had the edge was in goal, and a goaltender is the one player who can flatten a talent gap for a single night.

So the question is simple. If the Blues stay disciplined and keep the Stars' power play on the bench, this looks a lot like the last three meetings, one goal either way. If Dallas gets four or five power plays, last season's numbers say that's where the game gets decided.

This page is analysis only and carries no pick. Every BetLegend play is posted separately before the game and graded when it goes final at trustmyrecord.com.

Where Every Number Came From

Verification note (October 2, 2026, read between 9:00 and 9:20 AM PT). Puck drop, venue, TNT and truTV, the 0, 0, 0 records, probable goalies, injured reserve lists and the DraftKings open and current moneyline, puck line and total come from ESPN's NHL scoreboard and game summary for event 401891782, read at 9:16 AM PT. Current rosters come from ESPN's team roster pages. Last season's points, goals for and against, shots, power play, penalty kill and faceoff numbers come from the NHL stats API team summary for 2025 to 26; skater points and power play points from the NHL skater summary; goalie starts, record, save percentage, GAA and shutouts from the NHL goalie summary; home, road and last ten splits from the NHL standings API at the end of the regular season; head to head scores from the NHL club schedule API. No expected goals figure is shown because none was read from a verifiable source.

Frequently Asked Questions

What time is Blues vs Stars on October 2, 2026?
Friday, October 2, 2026 at 6:00 PM Pacific (9:00 PM Eastern) at American Airlines Center in Dallas, on TNT and truTV. It is the season opener for both teams.
What are the betting odds for Blues vs Stars?
At DraftKings via ESPN, read 9:16 AM Pacific on October 2: Dallas -185 and St. Louis +154 on the moneyline, Dallas -1.5 at +145 and St. Louis +1.5 at -175 on the puck line, and a total of 5.5 with the over -135 and the under +114. Dallas opened -205.
How did the Stars and Blues finish last season?
Dallas went 50 wins, 20 regulation losses and 12 overtime losses for 112 points and a +53 goal differential. St. Louis went 37, 33 and 12 for 86 points and a goal differential of -27. Dallas won the season series 3 games to 1.
Where is the game played?
American Airlines Center in Dallas, Texas. The Stars went 26, 11 and 4 there last season; the Blues went 17, 19 and 5 on the road.
Who are the key players to watch?
For Dallas: Jason Robertson (45 goals, 96 points last season), Wyatt Johnston (45 goals, 86 points), Mikko Rantanen (77 points in 64 games) and Miro Heiskanen (63 points). For St. Louis: Robert Thomas (64 points in 64 games), Dylan Holloway and Jimmy Snuggerud (51 points each), plus newcomers Connor McMichael and Mason McTavish.
Who starts in goal for Blues vs Stars?
ESPN lists Jake Oettinger as the expected Dallas starter (.899 save percentage, 2.59 GAA in 54 starts last season) and Joel Hofer for St. Louis (.910, 2.61 GAA, 6 shutouts in 43 starts).

Link to this breakdown

Earlier breakdowns